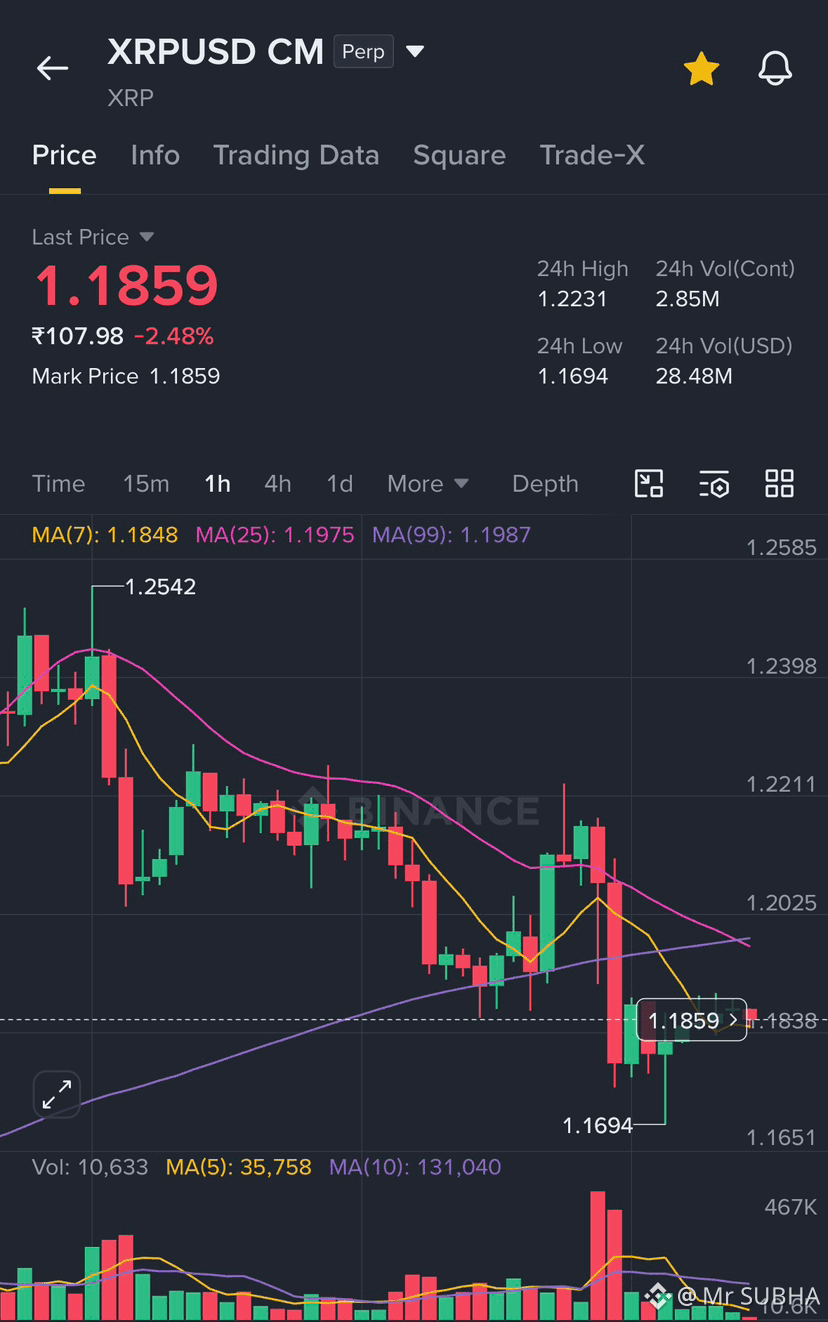
XRP/USD 1H Chart Analysis
Current Price: $1.1859 (−2.48%)
🔴 Bearish Signals (Stronger Case)
Moving Averages — Bearish
• Price is below all MAs: MA7 (1.1848), MA25 (1.1975), MA99 (1.1987)
• MA7 has crossed below MA25 and MA99 — classic death cross setup
• All MAs are sloping downward
Price Structure — Bearish
• Clear lower highs + lower lows from 1.2542 down to 1.1694
• Strong downtrend over the last 48 hours
• Recent bounce looks weak — just a pullback, not a reversal
Volume — Bearish
• Massive volume spike on the drop to 1.1694 = strong selling pressure
• Current volume (10,633) is well below MA5 (35,758) — no buying conviction
Performance — Bearish
• 30D: −14%, 90D: −17.5%, 180D: −36.65% — structurally weak
🟢 Mild Bullish Case
• Price bounced from 1.1694 support
• Small green candle recovery forming
• Could see a short-term relief bounce to 1.20–1.21 zone
📊 My Read
Bias: Bearish — the trend is clearly down. Any bounce toward 1.20–1.22 is likely a sell/short opportunity, not a reversal signal — unless price reclaims MA99 (1.1987) with strong volume.
Key levels to watch:
• Support: 1.1694 (recent low) → break = drop to ~1.14
• Resistance: 1.20 → 1.22 → 1.2542
This is technical analysis only, not financial advice. Always manage your risk.
Current Price: $1.1859 (−2.48%)
🔴 Bearish Signals (Stronger Case)
Moving Averages — Bearish
• Price is below all MAs: MA7 (1.1848), MA25 (1.1975), MA99 (1.1987)
• MA7 has crossed below MA25 and MA99 — classic death cross setup
• All MAs are sloping downward
Price Structure — Bearish
• Clear lower highs + lower lows from 1.2542 down to 1.1694
• Strong downtrend over the last 48 hours
• Recent bounce looks weak — just a pullback, not a reversal
Volume — Bearish
• Massive volume spike on the drop to 1.1694 = strong selling pressure
• Current volume (10,633) is well below MA5 (35,758) — no buying conviction
Performance — Bearish
• 30D: −14%, 90D: −17.5%, 180D: −36.65% — structurally weak
🟢 Mild Bullish Case
• Price bounced from 1.1694 support
• Small green candle recovery forming
• Could see a short-term relief bounce to 1.20–1.21 zone
📊 My Read
Bias: Bearish — the trend is clearly down. Any bounce toward 1.20–1.22 is likely a sell/short opportunity, not a reversal signal — unless price reclaims MA99 (1.1987) with strong volume.
Key levels to watch:
• Support: 1.1694 (recent low) → break = drop to ~1.14
• Resistance: 1.20 → 1.22 → 1.2542
This is technical analysis only, not financial advice. Always manage your risk.