Bitcoin $BTC Monthly Analysis: Is the Correction Nearing Its End?
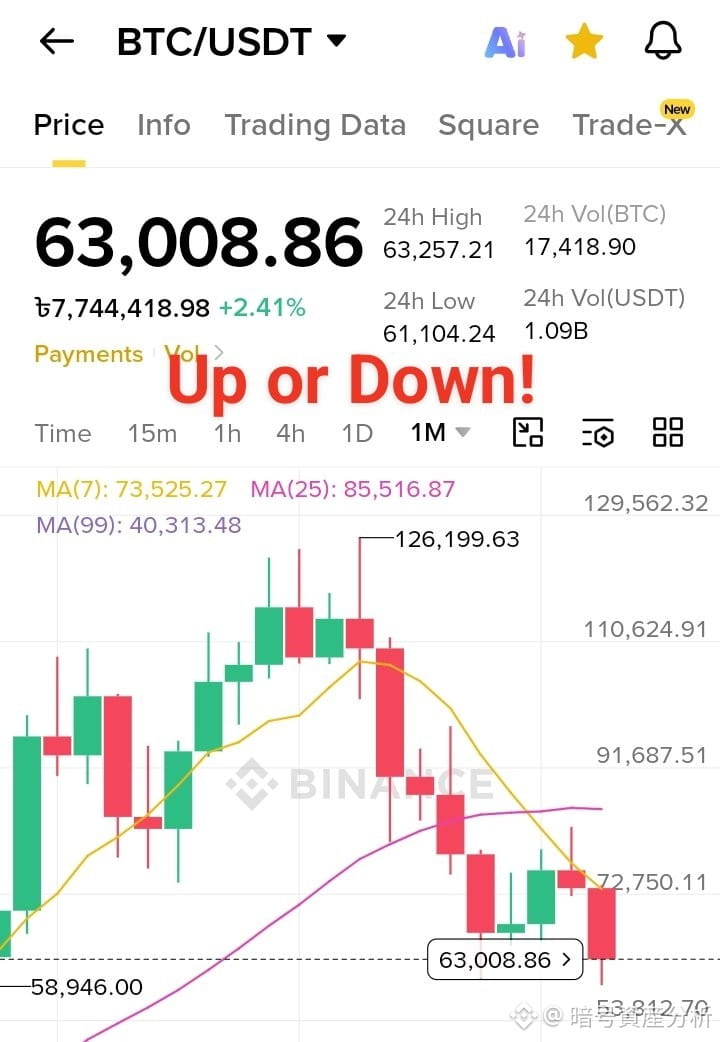
Bitcoin (BTC), the world's largest cryptocurrency, remains the benchmark of the entire digital asset market. After reaching a monthly high near $126,199, BTC has entered a significant correction phase, bringing the price down to around $63,008.
Current Market Overview
Current Price: $63,008
24H Change: +2.41%
24H High: $63,257
24H Low: $61,104
24H Volume: 17,418 BTC
Technical Analysis
Trend
The monthly chart shows a bearish correction after a strong bullish rally. Several consecutive red candles indicate profit-taking and market cooling.
Moving Averages
MA(7): 73,525
MA(25): 85,516
MA(99): 40,313
BTC is currently trading below both MA(7) and MA(25), which suggests short-term bearish pressure. However, the price remains above MA(99), meaning the long-term bullish structure is still intact.
Key Support Levels
$58,946
$53,812
These levels could act as strong buying zones if BTC continues to decline.
Key Resistance Levels
$72,750
$91,687
$110,624
A breakout above these resistance zones would signal renewed bullish momentum.
What Could Happen Next?
Bullish Scenario
If BTC holds above the $58K-$53K support region, buyers may regain control and push the price toward $72K and beyond.
Bearish Scenario
A monthly close below $53K could trigger deeper corrections toward lower support zones.
Trading Strategy
Wait for confirmation before entering large positions.
Use proper risk management and stop-loss.
Long-term investors may consider gradual accumulation near strong support areas.
Final Thoughts
Bitcoin is currently experiencing a healthy market correction after an extended rally. While short-term momentum remains weak, the long-term structure is still positive as long as major support levels hold. Patience, risk management, and disciplined investing remain essential in the current market environment.
What is your BTC prediction for the next 6 months? Share your thoughts below..
$BTC
#BTC #Write2Earrn
Bitcoin (BTC), the world's largest cryptocurrency, remains the benchmark of the entire digital asset market. After reaching a monthly high near $126,199, BTC has entered a significant correction phase, bringing the price down to around $63,008.
Current Market Overview
Current Price: $63,008
24H Change: +2.41%
24H High: $63,257
24H Low: $61,104
24H Volume: 17,418 BTC
Technical Analysis
Trend
The monthly chart shows a bearish correction after a strong bullish rally. Several consecutive red candles indicate profit-taking and market cooling.
Moving Averages
MA(7): 73,525
MA(25): 85,516
MA(99): 40,313
BTC is currently trading below both MA(7) and MA(25), which suggests short-term bearish pressure. However, the price remains above MA(99), meaning the long-term bullish structure is still intact.
Key Support Levels
$58,946
$53,812
These levels could act as strong buying zones if BTC continues to decline.
Key Resistance Levels
$72,750
$91,687
$110,624
A breakout above these resistance zones would signal renewed bullish momentum.
What Could Happen Next?
Bullish Scenario
If BTC holds above the $58K-$53K support region, buyers may regain control and push the price toward $72K and beyond.
Bearish Scenario
A monthly close below $53K could trigger deeper corrections toward lower support zones.
Trading Strategy
Wait for confirmation before entering large positions.
Use proper risk management and stop-loss.
Long-term investors may consider gradual accumulation near strong support areas.
Final Thoughts
Bitcoin is currently experiencing a healthy market correction after an extended rally. While short-term momentum remains weak, the long-term structure is still positive as long as major support levels hold. Patience, risk management, and disciplined investing remain essential in the current market environment.
What is your BTC prediction for the next 6 months? Share your thoughts below..
$BTC
#BTC #Write2Earrn