Market Structure
The trend is clearly bearish.
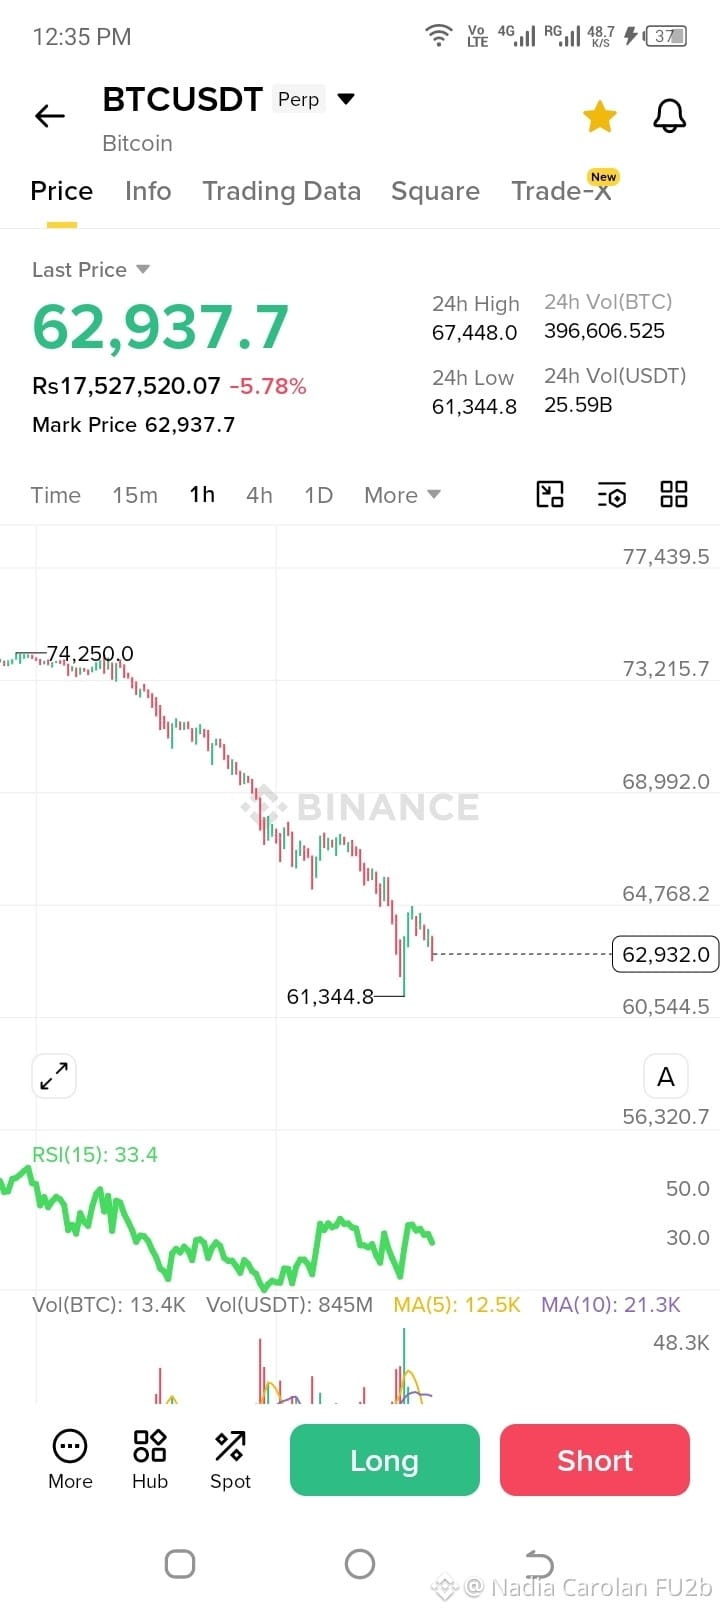
Price fell from around 74,250 to 61,344, creating a sequence of lower highs and lower lows.
The current bounce to ~62,900 looks more like a relief rally than a confirmed trend reversal.
RSI Analysis
RSI(15) is around 33–34.
That's close to oversold territory but not showing strong bullish momentum yet.
In strong downtrends, RSI can stay below 40 for a long time, so RSI alone is not a buy signal.
Key Levels
Support
61,300–61,500 (recent low)
If this breaks, next psychological zone is around 60,000
Resistance
64,700–65,000 (nearest resistance visible on chart)
68,900–69,000 (major resistance)
Bulls need to reclaim 65k first before talking about a larger recovery.
Trading Scenarios
Bullish case
Hold above 61.3k support.
Break and close above 65k on the 1H chart.
Target zone: 68.9k.
Bearish case
Rejection near 64k–65k.
Breakdown below 61.3k.
Could trigger another leg down toward 60k or lower.
My Read
At this moment I would classify it as bearish with a short-term oversold bounce. The chart does not yet show a trend reversal. Buyers need a strong break above the recent lower-high area to change the structure. General support/resistance analysis follows standard technical-analysis principles. �
Investopedia
If you tell me:
your entry price,
whether you're in a Long or Short,
and your leverage,
I can map out specific stop-loss and take-profit levels from this chart.$BTC
The trend is clearly bearish.
Price fell from around 74,250 to 61,344, creating a sequence of lower highs and lower lows.
The current bounce to ~62,900 looks more like a relief rally than a confirmed trend reversal.
RSI Analysis
RSI(15) is around 33–34.
That's close to oversold territory but not showing strong bullish momentum yet.
In strong downtrends, RSI can stay below 40 for a long time, so RSI alone is not a buy signal.
Key Levels
Support
61,300–61,500 (recent low)
If this breaks, next psychological zone is around 60,000
Resistance
64,700–65,000 (nearest resistance visible on chart)
68,900–69,000 (major resistance)
Bulls need to reclaim 65k first before talking about a larger recovery.
Trading Scenarios
Bullish case
Hold above 61.3k support.
Break and close above 65k on the 1H chart.
Target zone: 68.9k.
Bearish case
Rejection near 64k–65k.
Breakdown below 61.3k.
Could trigger another leg down toward 60k or lower.
My Read
At this moment I would classify it as bearish with a short-term oversold bounce. The chart does not yet show a trend reversal. Buyers need a strong break above the recent lower-high area to change the structure. General support/resistance analysis follows standard technical-analysis principles. �
Investopedia
If you tell me:
your entry price,
whether you're in a Long or Short,
and your leverage,
I can map out specific stop-loss and take-profit levels from this chart.$BTC