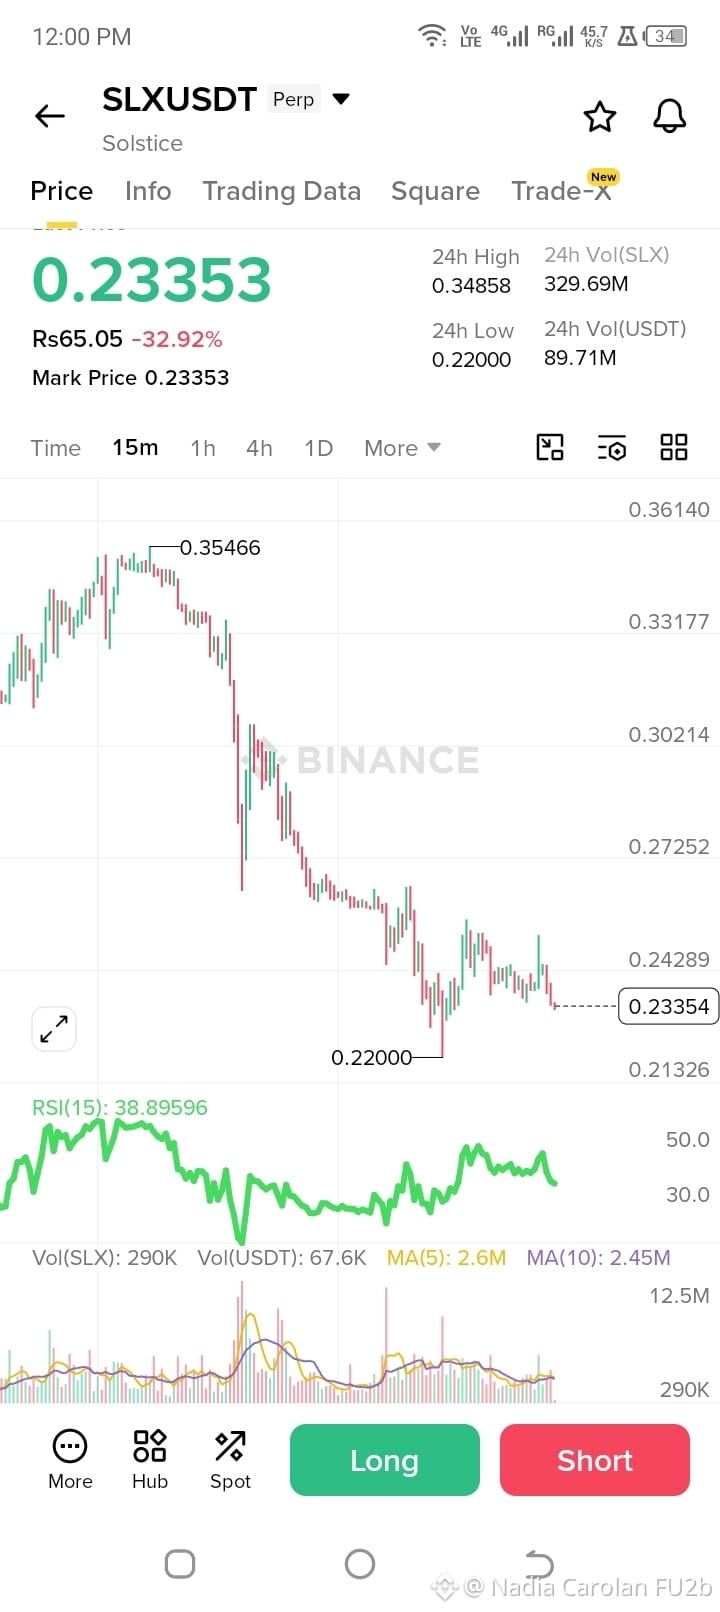
Looking only at this 15-minute chart (not financial advice):
What I see
Strong downtrend: Price fell from around 0.35 to 0.23, creating lower highs and lower lows.
No clear reversal yet: The recent bounce attempts are weak and sellers keep pushing price back down.
RSI around 39: Not extremely oversold. It suggests bearish momentum is still present, though selling pressure is not as intense as during the initial dump.
Volume has cooled: After the large selloff, volume decreased, which often means the market is waiting for the next catalyst.
Key levels
Support: ~0.2200 (the recent low)
Resistance: ~0.245–0.250
Stronger resistance higher up around 0.27–0.30
Bullish scenario
If price can reclaim and hold above 0.245–0.25 with increasing volume, it could attempt a relief rally toward 0.27+.
Bearish scenario
If 0.22 breaks convincingly, the trend remains bearish and another leg down becomes likely.
My read
Right now I'd classify this as bearish-to-neutral, not bullish. Catching a falling knife in a chart like this is risky because there is no confirmed trend reversal yet. For a long position, many traders would wait for:
A higher low to form.
A break of a recent swing high.
Volume increasing on green candles.
If you're already in a position, tell me:
Your entry price
Whether you're long or short
Your risk tolerance $SLX
What I see
Strong downtrend: Price fell from around 0.35 to 0.23, creating lower highs and lower lows.
No clear reversal yet: The recent bounce attempts are weak and sellers keep pushing price back down.
RSI around 39: Not extremely oversold. It suggests bearish momentum is still present, though selling pressure is not as intense as during the initial dump.
Volume has cooled: After the large selloff, volume decreased, which often means the market is waiting for the next catalyst.
Key levels
Support: ~0.2200 (the recent low)
Resistance: ~0.245–0.250
Stronger resistance higher up around 0.27–0.30
Bullish scenario
If price can reclaim and hold above 0.245–0.25 with increasing volume, it could attempt a relief rally toward 0.27+.
Bearish scenario
If 0.22 breaks convincingly, the trend remains bearish and another leg down becomes likely.
My read
Right now I'd classify this as bearish-to-neutral, not bullish. Catching a falling knife in a chart like this is risky because there is no confirmed trend reversal yet. For a long position, many traders would wait for:
A higher low to form.
A break of a recent swing high.
Volume increasing on green candles.
If you're already in a position, tell me:
Your entry price
Whether you're long or short
Your risk tolerance $SLX