
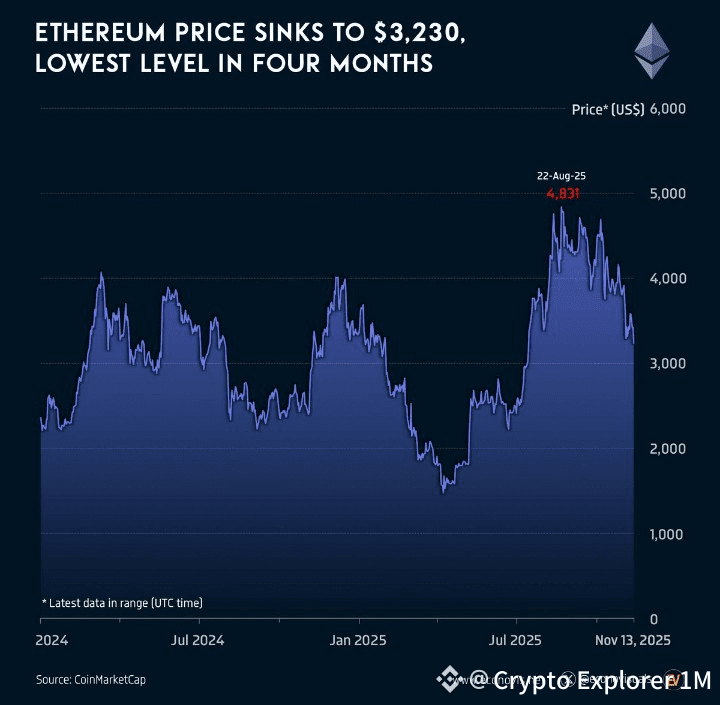
$1. Current Technicals & Trend
According to CoinCodex, Ethereum is in a neutral-to-bearish zone: many technical indicators lean bearish.
Key support zones are around $3,040–$2,880, while short-term resistance is seen near $3,210–$3,380.
2. Potential Upside Scenarios
Some analysts argue ETH could reach $5,000–$5,371 by November 2025, if it breaks out of its current consolidation.
Another bullish view projects $5,200 in the medium term, based on MACD momentum and strong support around $4,400.
According to a recent forecast, ETH could rally to $4,300–$4,400 within a couple of weeks if the breakout holds.
3. Macro / Fundamental Drivers
Institutional Interest: Big players continue to show interest in ETH due to its role in DeFi, staking, and tokenization.
Upgrades: Ethereum’s ongoing development (e.g., the “Glamsterdam” or other scaling upgrades) may improve performance and user adoption, positively influencing price.
Risks: If macro conditions turn negative, some bear-case scenarios suggest ETH could fall back toward $2,200.
4. Market Sentiment
According to CoinCodex, 81% of technical indicators are signaling bearish, while only 19% are bullish.
On social platforms, some traders mention that ETH’s price isn’t yet reflecting the strong on-chain activity and institutional accumulation. > “News has been very bullish … but the price is not reflective of that.”
🔎 Key Levels to Watch
Support: ~ $3,000–$3,200 — crucial for downside defense
Resistance: $4,400–$4,600 area — breaking above could open a path toward $5,000+ targets
Bottom line:
Ethereum is at a pivotal moment. On one hand, technicals are relatively weak, and many indicators lean bearish. On the other, there’s strong fundamental support (institutional demand, network upgrades) that could drive a significant rally if major resistance zones are broken. For now, it’s a “wait-and-see” scenario — confirmation above key resistance could set the stage for a bullish momo.$BTC
