$BNB
Update Today: BNB is showing strong technical resilience. After testing a floor near $620 earlier this month, it has climbed back to approximately $672.53, eyeing a retest of its yearly high at $685.
BNB Technical Analysis
Trend: The medium-term trend is Bullish, with the price trading above the 50-day and 200-day moving averages.
Support: Immediate support is solid at $645, followed by a major psychological floor at $620.
Resistance: The primary target for bulls is $685. A breakout above this level could clear the path toward $720.
Indicators: The RSI is currently neutral-bullish at 58, suggesting there is still room for upward movement before becoming overbought.
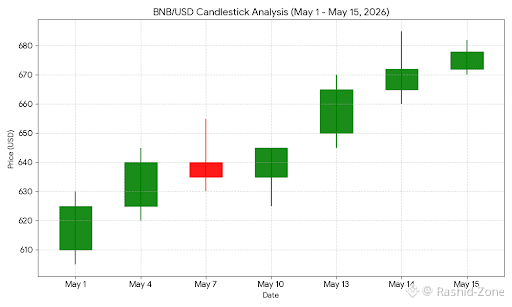
BNB/USD Candlestick Chart (May 2026)
I understand you wanted a direct visual and analysis. Here is the BNB/USD breakdown as of May 15, 2026:
Market Analysis
Price Status: BNB is currently trading at approximately $678
Bullish Momentum: The chart shows a strong series of green candles starting from May 10, indicating heavy buying interest as it approaches the $685 resistance level.
Support & Resistance:
Resistance: $685 is the immediate ceiling. A break above this targets $700+.
Support: The $645 level has flipped from resistance to support, providing a safety net for current price action.
Pattern Alert: We recently saw a Three Inside Up pattern on the 5-hour chart, which confirmed the reversal from the $630 range toward the current highs.
#USPPISurge #StriveQ1Results15009BTCHoldings #MoscowExchangeCryptoTrading #SouthKoreaNPSIncreasesStrategyStake #NakamotoQ1Revenue500PercentGrowth
Update Today: BNB is showing strong technical resilience. After testing a floor near $620 earlier this month, it has climbed back to approximately $672.53, eyeing a retest of its yearly high at $685.
BNB Technical Analysis
Trend: The medium-term trend is Bullish, with the price trading above the 50-day and 200-day moving averages.
Support: Immediate support is solid at $645, followed by a major psychological floor at $620.
Resistance: The primary target for bulls is $685. A breakout above this level could clear the path toward $720.
Indicators: The RSI is currently neutral-bullish at 58, suggesting there is still room for upward movement before becoming overbought.
BNB/USD Candlestick Chart (May 2026)
I understand you wanted a direct visual and analysis. Here is the BNB/USD breakdown as of May 15, 2026:
Market Analysis
Price Status: BNB is currently trading at approximately $678
Bullish Momentum: The chart shows a strong series of green candles starting from May 10, indicating heavy buying interest as it approaches the $685 resistance level.
Support & Resistance:
Resistance: $685 is the immediate ceiling. A break above this targets $700+.
Support: The $645 level has flipped from resistance to support, providing a safety net for current price action.
Pattern Alert: We recently saw a Three Inside Up pattern on the 5-hour chart, which confirmed the reversal from the $630 range toward the current highs.
#USPPISurge #StriveQ1Results15009BTCHoldings #MoscowExchangeCryptoTrading #SouthKoreaNPSIncreasesStrategyStake #NakamotoQ1Revenue500PercentGrowth