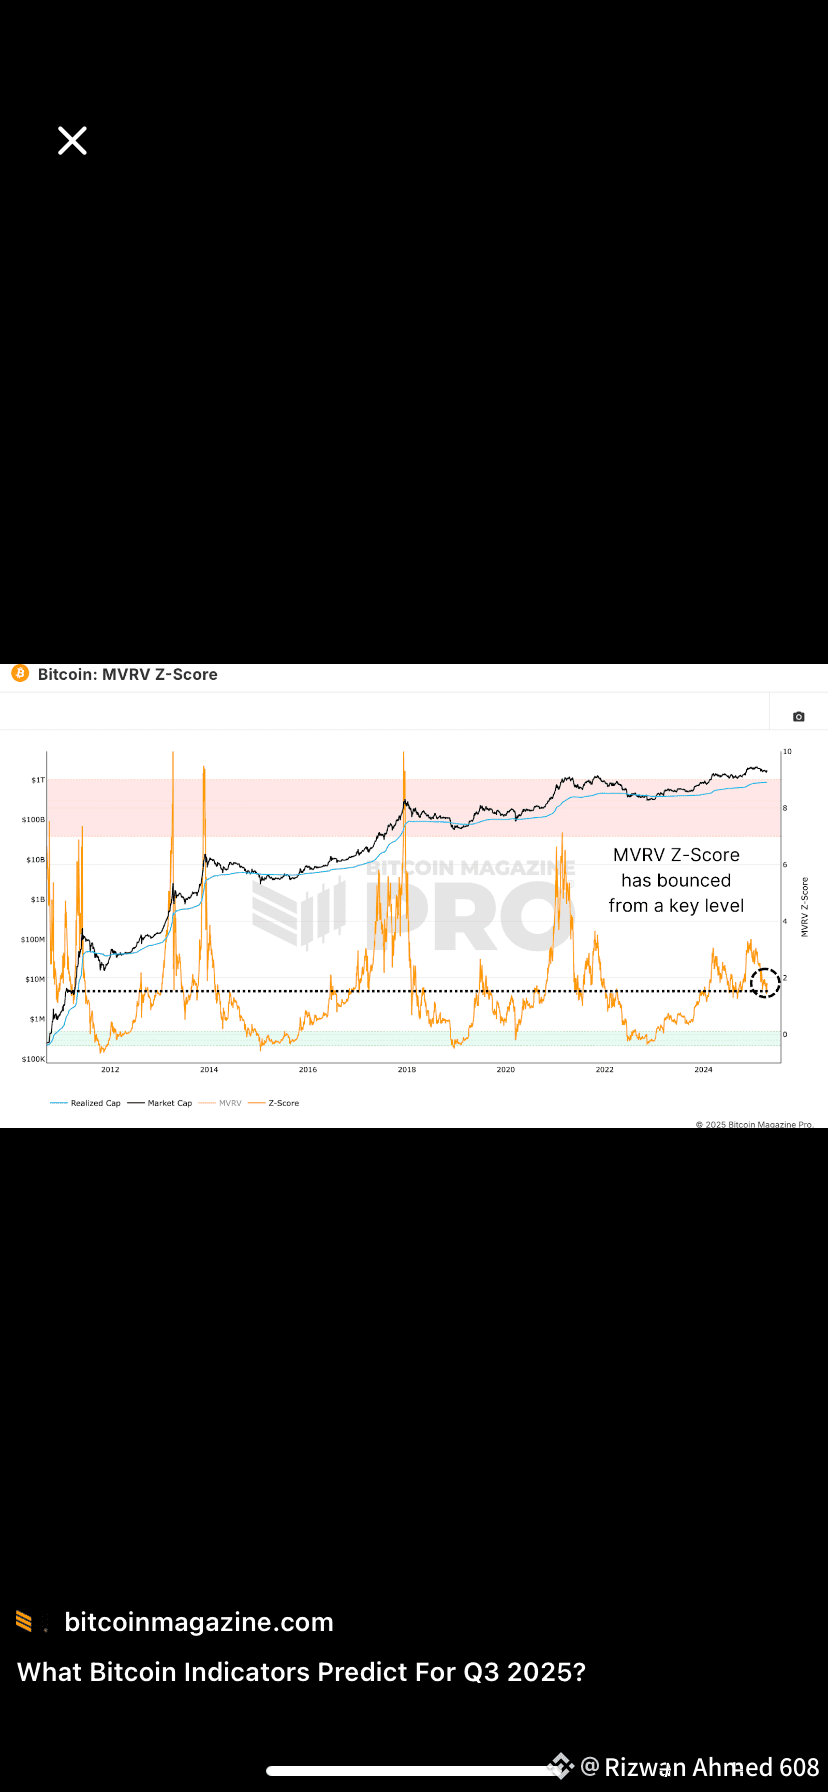
Here’s a short latest analysis of Bitcoin ($BTC ), based on current market data and technical trends:
⸻
🔍 Market Snapshot
• Bitcoin is trading in the ballpark of US $100,000–102,000, having recently slipped below the key support at US $100 K. 
• Technical indicators are showing a mixed picture: some moving-average signals suggest positive momentum, while overall trend bias remains bearish to neutral until some key levels are reclaimed. 
• On-chain data and institutional flows indicate that long-term holders (“whales”) are beginning to distribute, while some accumulation zones have formed around current levels. 
⸻
⚠️ Key Levels & What to Watch
• Support zones to monitor: around US $100 K and slightly below (potential next support near US $95 K) if the current support fails. 
• Resistance zone: near US $114 K and above. Reclaiming this level would help shift sentiment more bullish. 
• Market catalyst: Historical 4-year Bitcoin cycles may still be at play — though some analysts argue they’re “may not be dead” yet. 
• Macro & sentiment risk: If Bitcoin cannot hold the support and broader risk-assets falter, the price could slide significantly. 
⸻
✅ What Could Happen
• If BTC holds above US $100 K and reclaims US $114 K, we may see renewed upside momentum — potentially aiming toward higher targets later in the year.
• If support breaks decisively, a drop toward US $95 K (or even lower) becomes increasingly plausible.
• For investors: this is a watch zone. Holding through the support wears risk; reclaiming resistance could create opportunity.
⸻
🧭 Bottom Line
Bitcoin’s current position is critical: it’s at a crossroad. Sentiment is cautious. Key support must hold for the bullish case to regain strength. Until then, expect volatile swings and remain alert to both upside potential and downside risk.
⸻
If you like, I can pull together a detailed chart with annotated support/resistance for Bitcoin — would that be helpful for your page?
#ADPJobsSurge #BinanceHODLerSAPIEN #BinanceHODLerMMT
⸻
🔍 Market Snapshot
• Bitcoin is trading in the ballpark of US $100,000–102,000, having recently slipped below the key support at US $100 K. 
• Technical indicators are showing a mixed picture: some moving-average signals suggest positive momentum, while overall trend bias remains bearish to neutral until some key levels are reclaimed. 
• On-chain data and institutional flows indicate that long-term holders (“whales”) are beginning to distribute, while some accumulation zones have formed around current levels. 
⸻
⚠️ Key Levels & What to Watch
• Support zones to monitor: around US $100 K and slightly below (potential next support near US $95 K) if the current support fails. 
• Resistance zone: near US $114 K and above. Reclaiming this level would help shift sentiment more bullish. 
• Market catalyst: Historical 4-year Bitcoin cycles may still be at play — though some analysts argue they’re “may not be dead” yet. 
• Macro & sentiment risk: If Bitcoin cannot hold the support and broader risk-assets falter, the price could slide significantly. 
⸻
✅ What Could Happen
• If BTC holds above US $100 K and reclaims US $114 K, we may see renewed upside momentum — potentially aiming toward higher targets later in the year.
• If support breaks decisively, a drop toward US $95 K (or even lower) becomes increasingly plausible.
• For investors: this is a watch zone. Holding through the support wears risk; reclaiming resistance could create opportunity.
⸻
🧭 Bottom Line
Bitcoin’s current position is critical: it’s at a crossroad. Sentiment is cautious. Key support must hold for the bullish case to regain strength. Until then, expect volatile swings and remain alert to both upside potential and downside risk.
⸻
If you like, I can pull together a detailed chart with annotated support/resistance for Bitcoin — would that be helpful for your page?
#ADPJobsSurge #BinanceHODLerSAPIEN #BinanceHODLerMMT