$BNB 🔻 BNB Price Analysis: Sharp Correction, But Oversold Zone Could Bring a Bounce.
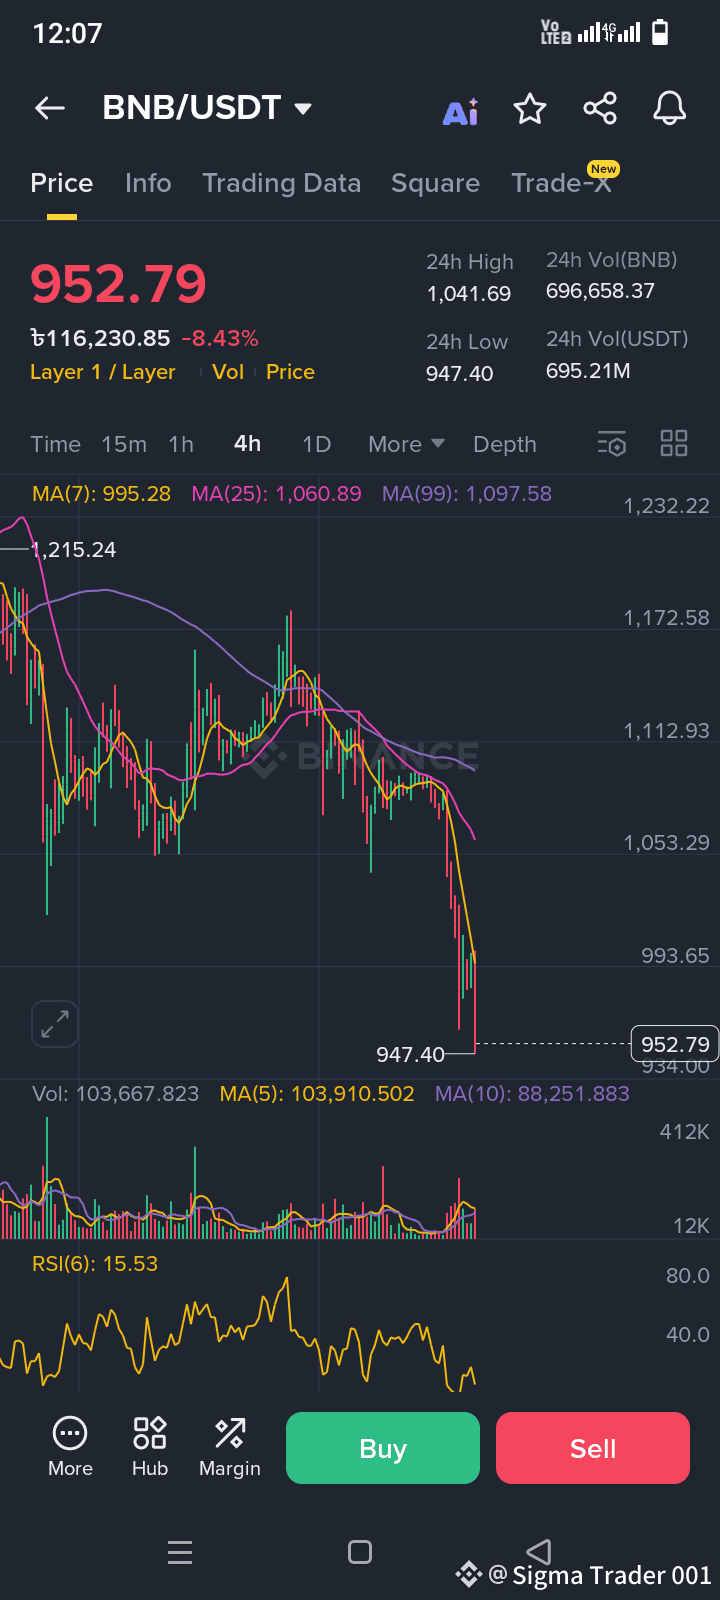
BNB faced a strong sell-off in the last 24 hours, dropping over 8% and testing the ₮947 support zone. The move follows a clear break below all major moving averages (MA7, MA25, MA99) — confirming short-term bearish momentum.
📉 Trend Overview (4H Chart)
Current Price: ₮952.79
24h High / Low: ₮1,041 – ₮947
MA Trend: All three moving averages are sloping downward, showing that sellers are still in control.
RSI (6): At 15.53, BNB is in the deep oversold zone, which often signals a potential short-term relief bounce or sideways consolidation before the next move.
🔑 Key Support & Resistance Levels
Support: ₮947 → ₮920 (next possible zone if breakdown continues)
Resistance: ₮995 → ₮1,060 (short-term recovery target)
🔍 Volume & Market Behavior
There’s a visible spike in selling volume, suggesting panic exits or liquidations. However, such volume spikes often occur near local bottoms, meaning traders should watch if buyers start stepping in around ₮940–₮960.
📊 Possible Scenarios
Bullish Case: If price holds above ₮947 and RSI rises above 30, BNB could retest ₮995–₮1,060 soon.
Bearish Case: If ₮947 breaks decisively, the next target may be around ₮920–₮900.
💬 My Take:
BNB is showing exhaustion after a heavy drop. I’ll watch closely for a bounce signal on the next 1–2 candles before deciding any short-term trade. Patience matters more than reaction here.
📈 #BNB #BNBUSDT #CryptoAnalysis #BinanceSquare #WriteToEarn