ذروة 2025: وصلت BTC إلى ذروتها عند حوالي 126K دولار في أكتوبر 2025، مدفوعة بإنشاء الولايات المتحدة.
تبريد 2026: منذ بداية 2026، كان السعر ينخفض تدريجياً. نحن نشهد حالياً "ربع أحمر ثلاثي" (ثلاثة أشهر متتالية من الإغلاقات الهبوطية أو المحايدة)، وهو حدث نادر في سوق صاعدة مستمرة.
متوسط الحركة لمدة 200 يوم: على الرسوم البيانية اليومية/الأسبوعية، بدأ متوسط الحركة لمدة 200 يوم في الميل للأسفل (منذ 24 مارس)، مما يشير إلى أن الاتجاه المتوسط إلى الطويل الأجل هش حالياً.
2. مستويات HTF الرئيسية للمراقبة
يركز المحللون على عدة مستويات "خط في الرمل" التي ستحدد بقية عام 2026:
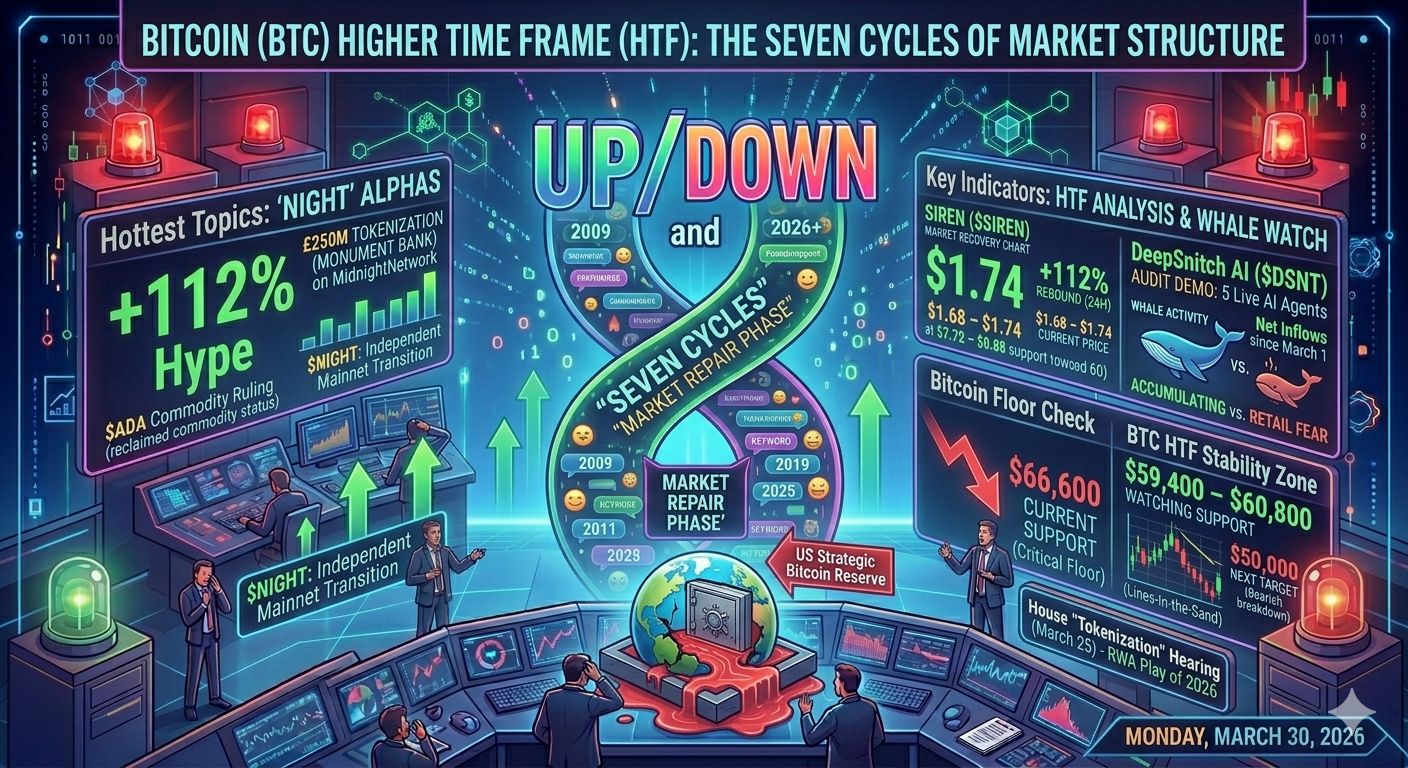
الدعم الحالي (66,600 دولار): هذه هي الخط الفاصل الفوري. من الضروري الحفاظ على هذا المستوى في إغلاق أسبوعي لتجنب الانزلاق إلى "شتاء تشفير" عميق.
الأرضية (59,400 – 60,800 دولار): تمثل هذه المنطقة الحصن النفسي والتقني النهائي. من المحتمل أن يؤدي كسر مستوى 60K دولار إلى إبطال الهيكل الصاعد الحالي واستهداف منطقة 50,000 دولار.
المقاومة الرئيسية (72,000 دولار): لاستعادة زخم HTF الصاعد، يجب على BTC تجاوز عقبة 72K دولار. كسر هذا المستوى من شأنه أن يبطل نمط "الرأس والكتفين" الحالي الذي يتشكل على العديد من الرسوم البيانية.
3. السياق الأساسي الكلي
المرونة المؤسسية: على الرغم من انخفاض السعر، شهدت ETFs الفورية تدفقات صافية بلغت 1.53 مليار دولار منذ بداية مارس. يبدو أن المؤسسات "تشترى في الدم" بينما يشعر التجزئة بـ "خوف شديد" (المؤشر: 11/100).
صدمة إيران: التوترات الجيوسياسية (أزمة هرمز) وارتفاع أسعار النفط (قريب من 110 دولار/برميل) تخلق ضغط "خطر منخفض". ومع ذلك، قدمت تعليقات الرئيس ترامب الأخيرة حول صفقة محتملة مع إيران رفعاً متواضعاً بنسبة 1.5% ليصل إلى 67,572 دولار اليوم.
معلم 20M: مارس 2026 هو شهر تاريخي حيث من المتوقع أن يتم تعدين البيتكوين العشرين مليون، مما يزيد من تضييق العرض اليومي من العملات الجديدة. $BTC
تبريد 2026: منذ بداية 2026، كان السعر ينخفض تدريجياً. نحن نشهد حالياً "ربع أحمر ثلاثي" (ثلاثة أشهر متتالية من الإغلاقات الهبوطية أو المحايدة)، وهو حدث نادر في سوق صاعدة مستمرة.
متوسط الحركة لمدة 200 يوم: على الرسوم البيانية اليومية/الأسبوعية، بدأ متوسط الحركة لمدة 200 يوم في الميل للأسفل (منذ 24 مارس)، مما يشير إلى أن الاتجاه المتوسط إلى الطويل الأجل هش حالياً.
2. مستويات HTF الرئيسية للمراقبة
يركز المحللون على عدة مستويات "خط في الرمل" التي ستحدد بقية عام 2026:
الدعم الحالي (66,600 دولار): هذه هي الخط الفاصل الفوري. من الضروري الحفاظ على هذا المستوى في إغلاق أسبوعي لتجنب الانزلاق إلى "شتاء تشفير" عميق.
الأرضية (59,400 – 60,800 دولار): تمثل هذه المنطقة الحصن النفسي والتقني النهائي. من المحتمل أن يؤدي كسر مستوى 60K دولار إلى إبطال الهيكل الصاعد الحالي واستهداف منطقة 50,000 دولار.
المقاومة الرئيسية (72,000 دولار): لاستعادة زخم HTF الصاعد، يجب على BTC تجاوز عقبة 72K دولار. كسر هذا المستوى من شأنه أن يبطل نمط "الرأس والكتفين" الحالي الذي يتشكل على العديد من الرسوم البيانية.
3. السياق الأساسي الكلي
المرونة المؤسسية: على الرغم من انخفاض السعر، شهدت ETFs الفورية تدفقات صافية بلغت 1.53 مليار دولار منذ بداية مارس. يبدو أن المؤسسات "تشترى في الدم" بينما يشعر التجزئة بـ "خوف شديد" (المؤشر: 11/100).
صدمة إيران: التوترات الجيوسياسية (أزمة هرمز) وارتفاع أسعار النفط (قريب من 110 دولار/برميل) تخلق ضغط "خطر منخفض". ومع ذلك، قدمت تعليقات الرئيس ترامب الأخيرة حول صفقة محتملة مع إيران رفعاً متواضعاً بنسبة 1.5% ليصل إلى 67,572 دولار اليوم.
معلم 20M: مارس 2026 هو شهر تاريخي حيث من المتوقع أن يتم تعدين البيتكوين العشرين مليون، مما يزيد من تضييق العرض اليومي من العملات الجديدة. $BTC