

612 Ceros
25.4k منشورات

612 Ceros
 تحقُّق Binance Square الإضافي
إبلاغ
حظر المُستخدم
📊 Crypto strategist | Market signals daily | Trade smart, not emotional. Find me on X: @612Ceros
مُتداول بمُعدّل مرتفع
5 سنوات
12 تتابع
177.8K+ المتابعون
226.7K+ إعجاب
منشورات
الكل
اقتباسات
PINNED
·
--
صاعد
🚀 أتقن السوق. ارتقِ بمزاياك مع 612 Ceros Futures Prime.
سوق العملات الرقمية لا يغفر الأخطاء. اجتياز التقلب الهائل في Binance Futures يتطلب أكثر من مجرد حظ أو حدس—إنه يحتاج إلى نظام مُثبت، وانضباط صارم، وفهم عميق لآليات السوق.
إذا كنت متعبًا من التداول في الظلام وجاهزًا لنقل استراتيجيتك إلى المستوى التالي، مرحبًا بك في 612 Ceros Futures Prime.
أنشأنا هذه المجتمعة لهدف واحد محدد: مساعدة المتداولين الجادين على صقل مزاياهم. نحن لا نعتمد على الضجيج أو الإثارة أو المقامرة. بدلًا من ذلك، نركز على بيانات قابلة للتنفيذ، وتحليل موضوعي للسوق، وتنفيذ صفقات ذات احتمالية عالية.
ما ستحصل عليه داخل Prime:
📊 تحليل عميق للسوق: تفصيلات فورية لحركة السعر، وتغيرات الحجم، ومستويات بنيوية محورية على Binance Futures.
🛡️ التحكم في المخاطر والرافعة: استراتيجيات احترافية لحماية محفظتك من التصفّيات غير المتوقعة وتحسين استخدام الرافعة. 🧠 بيئة تداول على مستوى عالٍ: مناقشة صفقات حقيقية، مراجعة تنفيذ الصفقات، والنمو جنبًا إلى جنب مع شبكة من أفراد ملتزمين ومتوافقين في الفكر.
يأتي النجاح في تداول العقود الآجلة من الأشخاص الذين تتداول معهم ومن المعلومات التي تعالجها. سواء كنت ترغب في تحسين استراتيجياتك الحالية أو تريد أن تكون جزءًا من مجتمع حاد ومركّز للغاية، فأنت في المكان الصحيح.
👉 ادخل اليوم إلى 612 Ceros Futures Prime:
[https://app.binance.com/uni-qr/9prSvcJT](https://app.binance.com/uni-qr/9prSvcJT)
👇 اترك تعليقًا أو أرسل رسالة مباشرة (DM) إذا كانت لديك أي أسئلة حول الانضمام!
🚀 أتقن السوق. ارتقِ بمزاياك مع 612 Ceros Futures Prime.
سوق العملات الرقمية لا يغفر الأخطاء. اجتياز التقلب الهائل في Binance Futures يتطلب أكثر من مجرد حظ أو حدس—إنه يحتاج إلى نظام مُثبت، وانضباط صارم، وفهم عميق لآليات السوق.
إذا كنت متعبًا من التداول في الظلام وجاهزًا لنقل استراتيجيتك إلى المستوى التالي، مرحبًا بك في 612 Ceros Futures Prime.
أنشأنا هذه المجتمعة لهدف واحد محدد: مساعدة المتداولين الجادين على صقل مزاياهم. نحن لا نعتمد على الضجيج أو الإثارة أو المقامرة. بدلًا من ذلك، نركز على بيانات قابلة للتنفيذ، وتحليل موضوعي للسوق، وتنفيذ صفقات ذات احتمالية عالية.
ما ستحصل عليه داخل Prime:
📊 تحليل عميق للسوق: تفصيلات فورية لحركة السعر، وتغيرات الحجم، ومستويات بنيوية محورية على Binance Futures.
🛡️ التحكم في المخاطر والرافعة: استراتيجيات احترافية لحماية محفظتك من التصفّيات غير المتوقعة وتحسين استخدام الرافعة. 🧠 بيئة تداول على مستوى عالٍ: مناقشة صفقات حقيقية، مراجعة تنفيذ الصفقات، والنمو جنبًا إلى جنب مع شبكة من أفراد ملتزمين ومتوافقين في الفكر.
يأتي النجاح في تداول العقود الآجلة من الأشخاص الذين تتداول معهم ومن المعلومات التي تعالجها. سواء كنت ترغب في تحسين استراتيجياتك الحالية أو تريد أن تكون جزءًا من مجتمع حاد ومركّز للغاية، فأنت في المكان الصحيح.
👉 ادخل اليوم إلى 612 Ceros Futures Prime:
https://app.binance.com/uni-qr/9prSvcJT
👇 اترك تعليقًا أو أرسل رسالة مباشرة (DM) إذا كانت لديك أي أسئلة حول الانضمام!
سوق العملات الرقمية لا يغفر الأخطاء. اجتياز التقلب الهائل في Binance Futures يتطلب أكثر من مجرد حظ أو حدس—إنه يحتاج إلى نظام مُثبت، وانضباط صارم، وفهم عميق لآليات السوق.
إذا كنت متعبًا من التداول في الظلام وجاهزًا لنقل استراتيجيتك إلى المستوى التالي، مرحبًا بك في 612 Ceros Futures Prime.
أنشأنا هذه المجتمعة لهدف واحد محدد: مساعدة المتداولين الجادين على صقل مزاياهم. نحن لا نعتمد على الضجيج أو الإثارة أو المقامرة. بدلًا من ذلك، نركز على بيانات قابلة للتنفيذ، وتحليل موضوعي للسوق، وتنفيذ صفقات ذات احتمالية عالية.
ما ستحصل عليه داخل Prime:
📊 تحليل عميق للسوق: تفصيلات فورية لحركة السعر، وتغيرات الحجم، ومستويات بنيوية محورية على Binance Futures.
🛡️ التحكم في المخاطر والرافعة: استراتيجيات احترافية لحماية محفظتك من التصفّيات غير المتوقعة وتحسين استخدام الرافعة. 🧠 بيئة تداول على مستوى عالٍ: مناقشة صفقات حقيقية، مراجعة تنفيذ الصفقات، والنمو جنبًا إلى جنب مع شبكة من أفراد ملتزمين ومتوافقين في الفكر.
يأتي النجاح في تداول العقود الآجلة من الأشخاص الذين تتداول معهم ومن المعلومات التي تعالجها. سواء كنت ترغب في تحسين استراتيجياتك الحالية أو تريد أن تكون جزءًا من مجتمع حاد ومركّز للغاية، فأنت في المكان الصحيح.
👉 ادخل اليوم إلى 612 Ceros Futures Prime:
https://app.binance.com/uni-qr/9prSvcJT
👇 اترك تعليقًا أو أرسل رسالة مباشرة (DM) إذا كانت لديك أي أسئلة حول الانضمام!
12
1
22
2.5k
·
--
صاعد
اخترق ZEC ترتيبًا صعوديًا على الإطار اليومي، والمشترون يسيطرون.
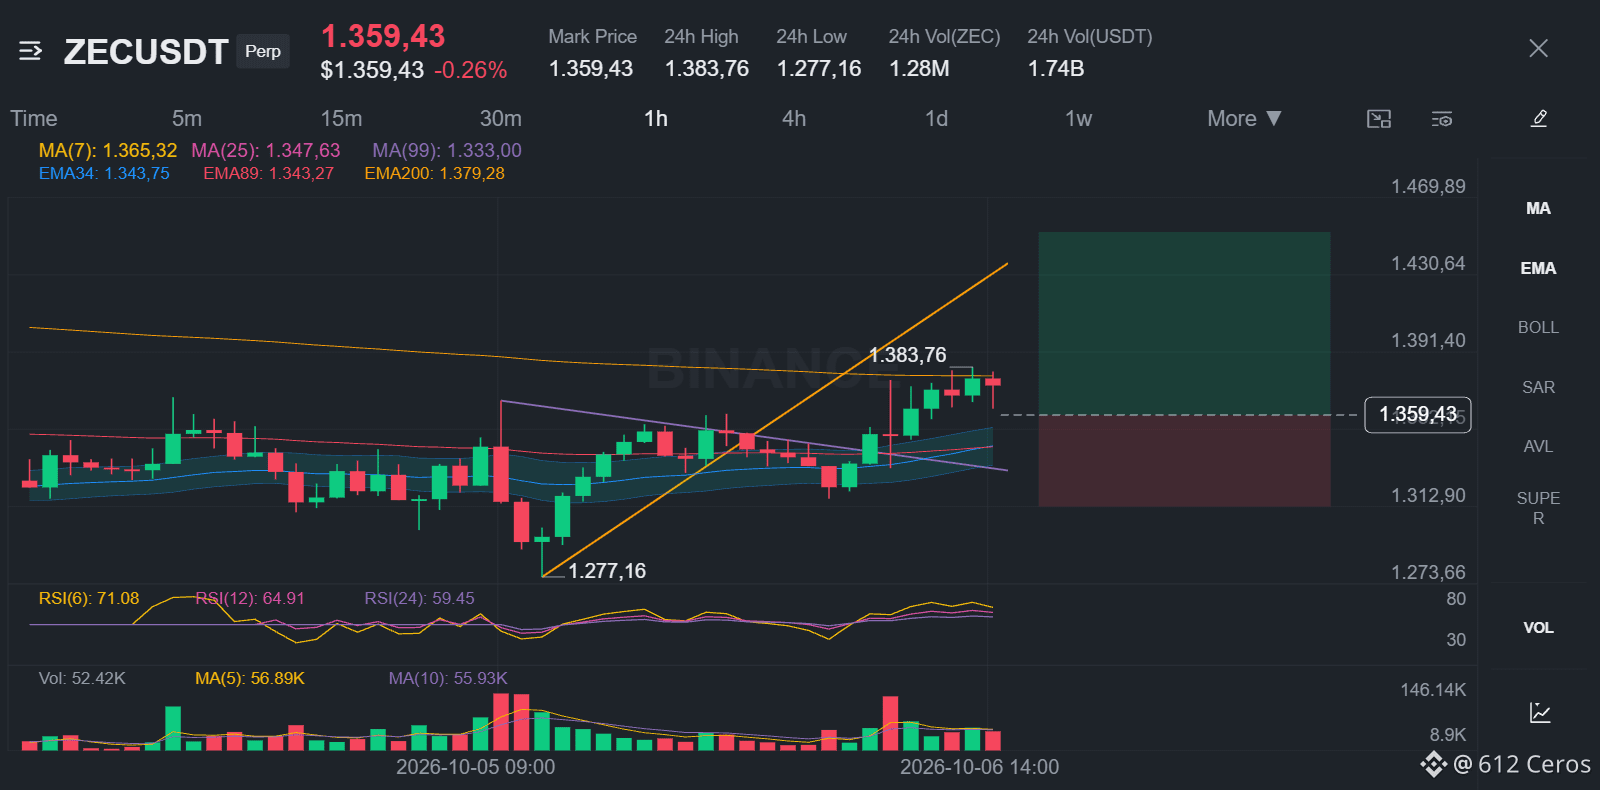
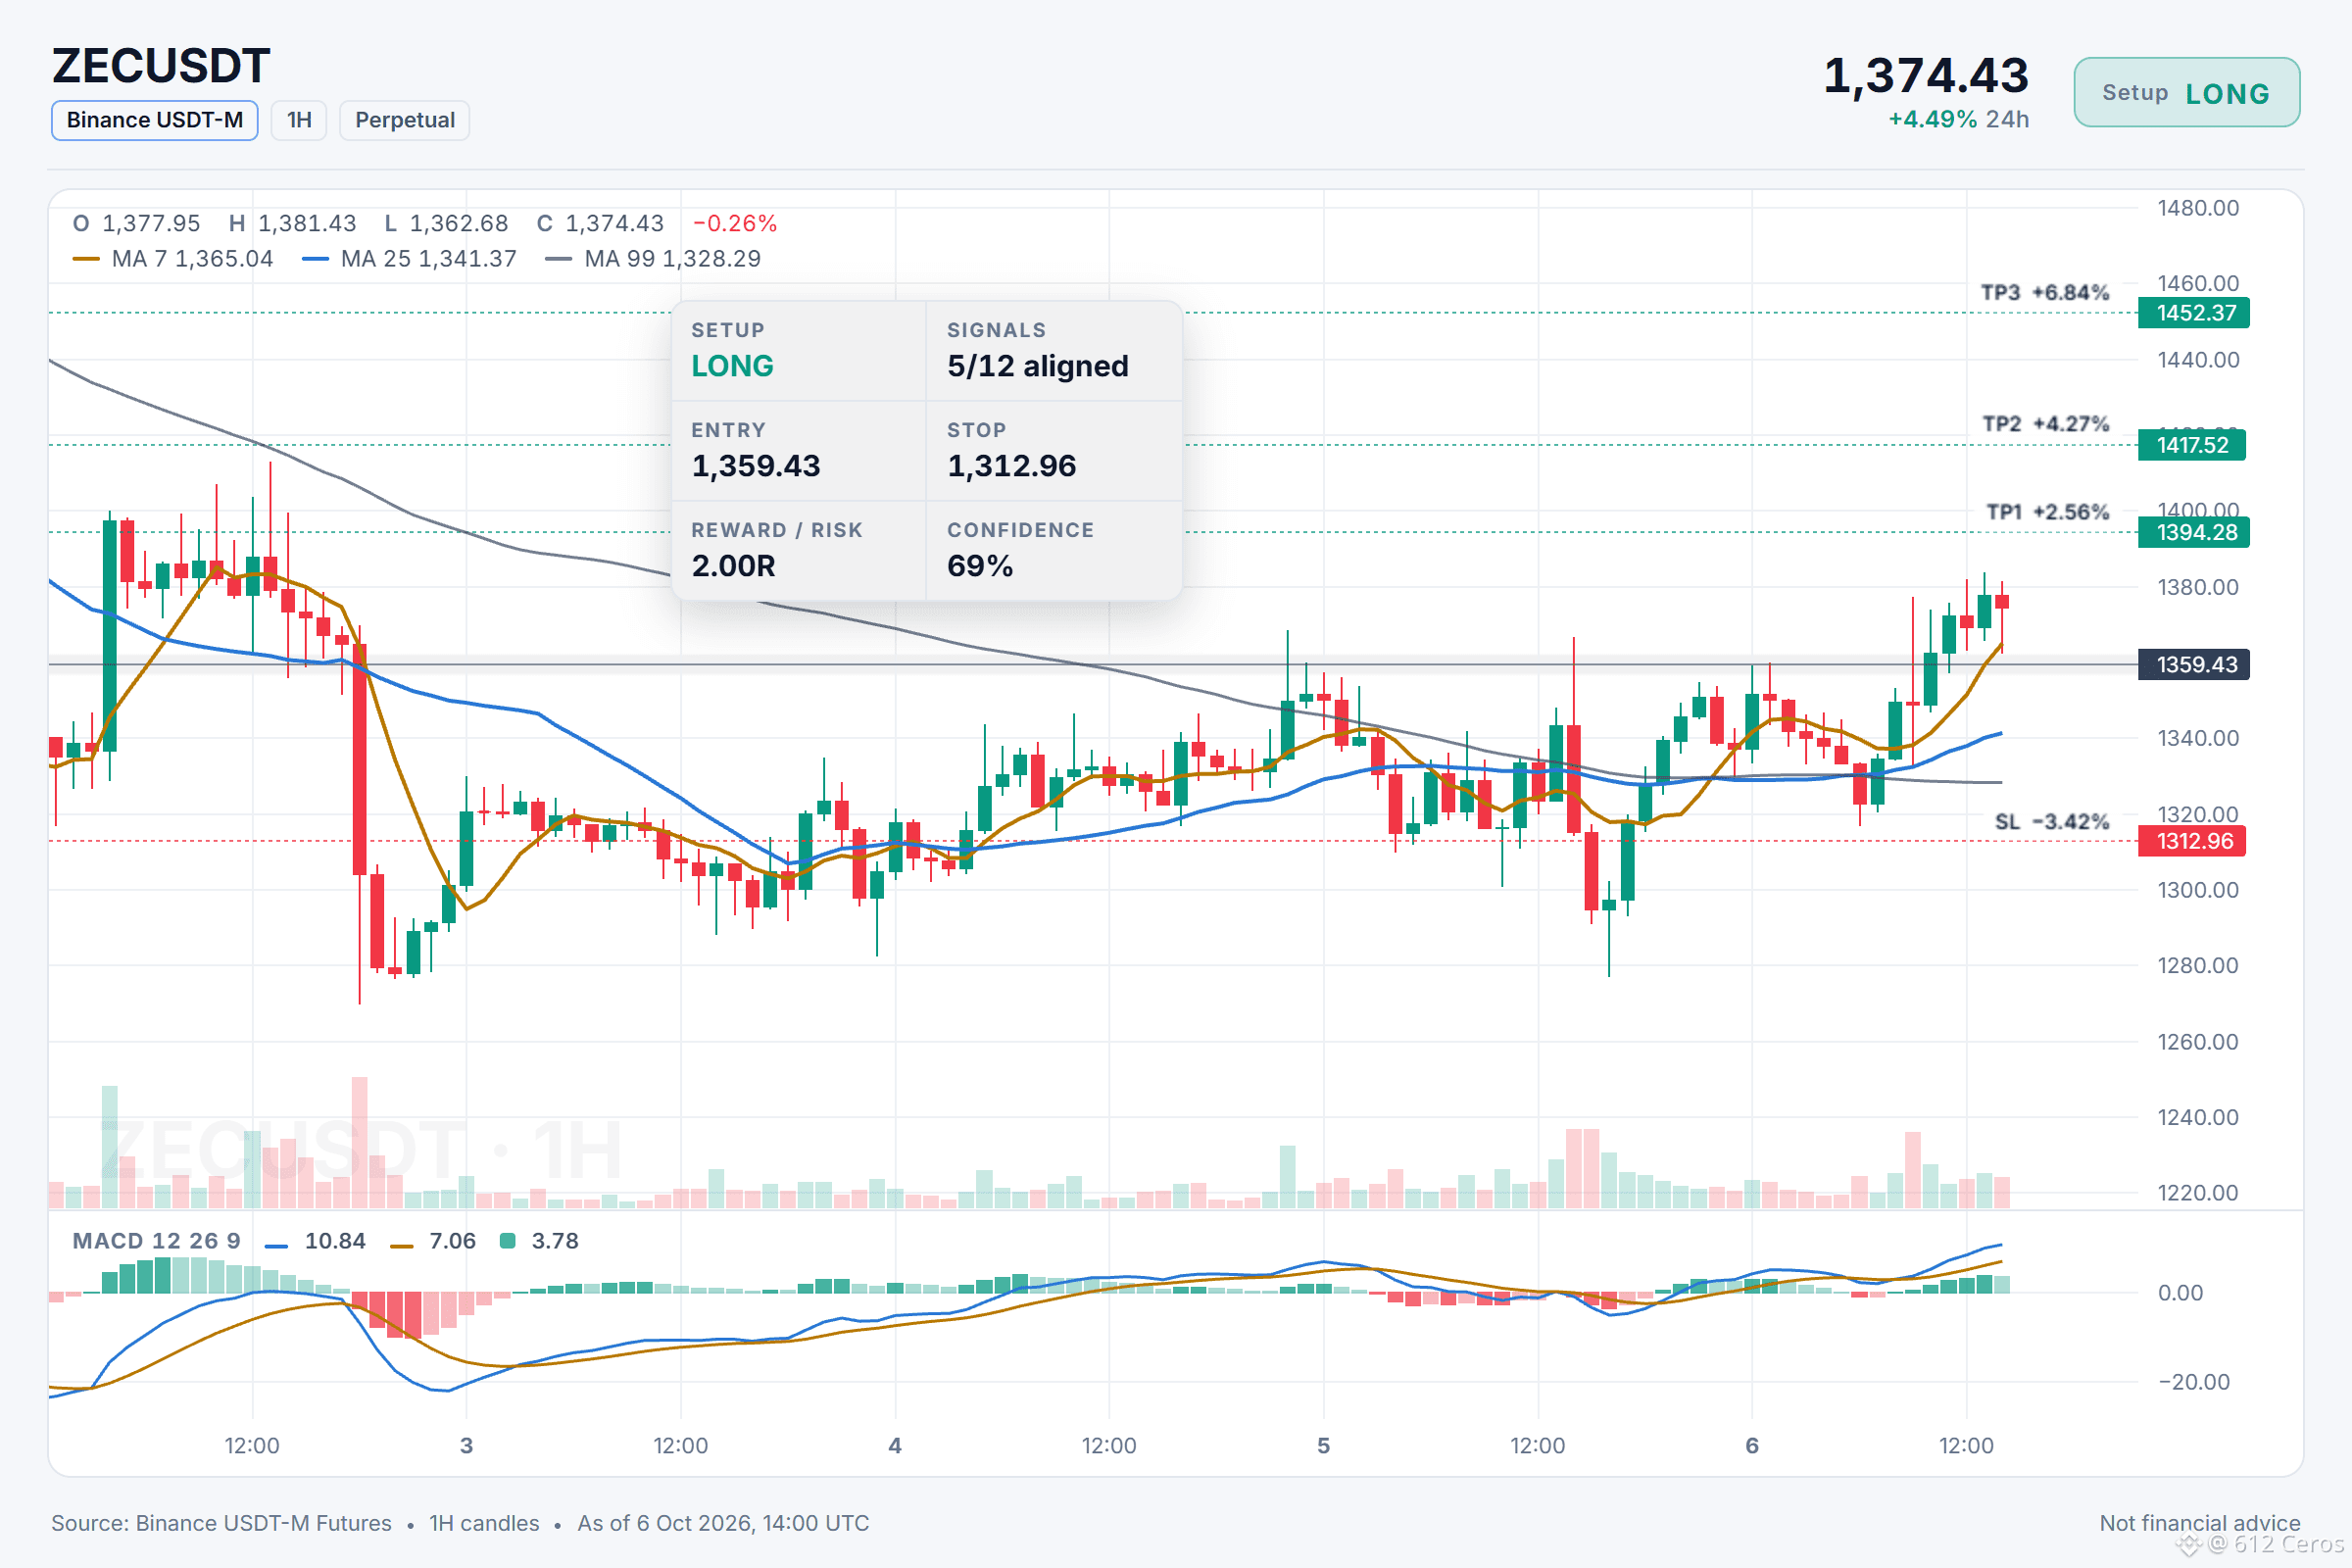
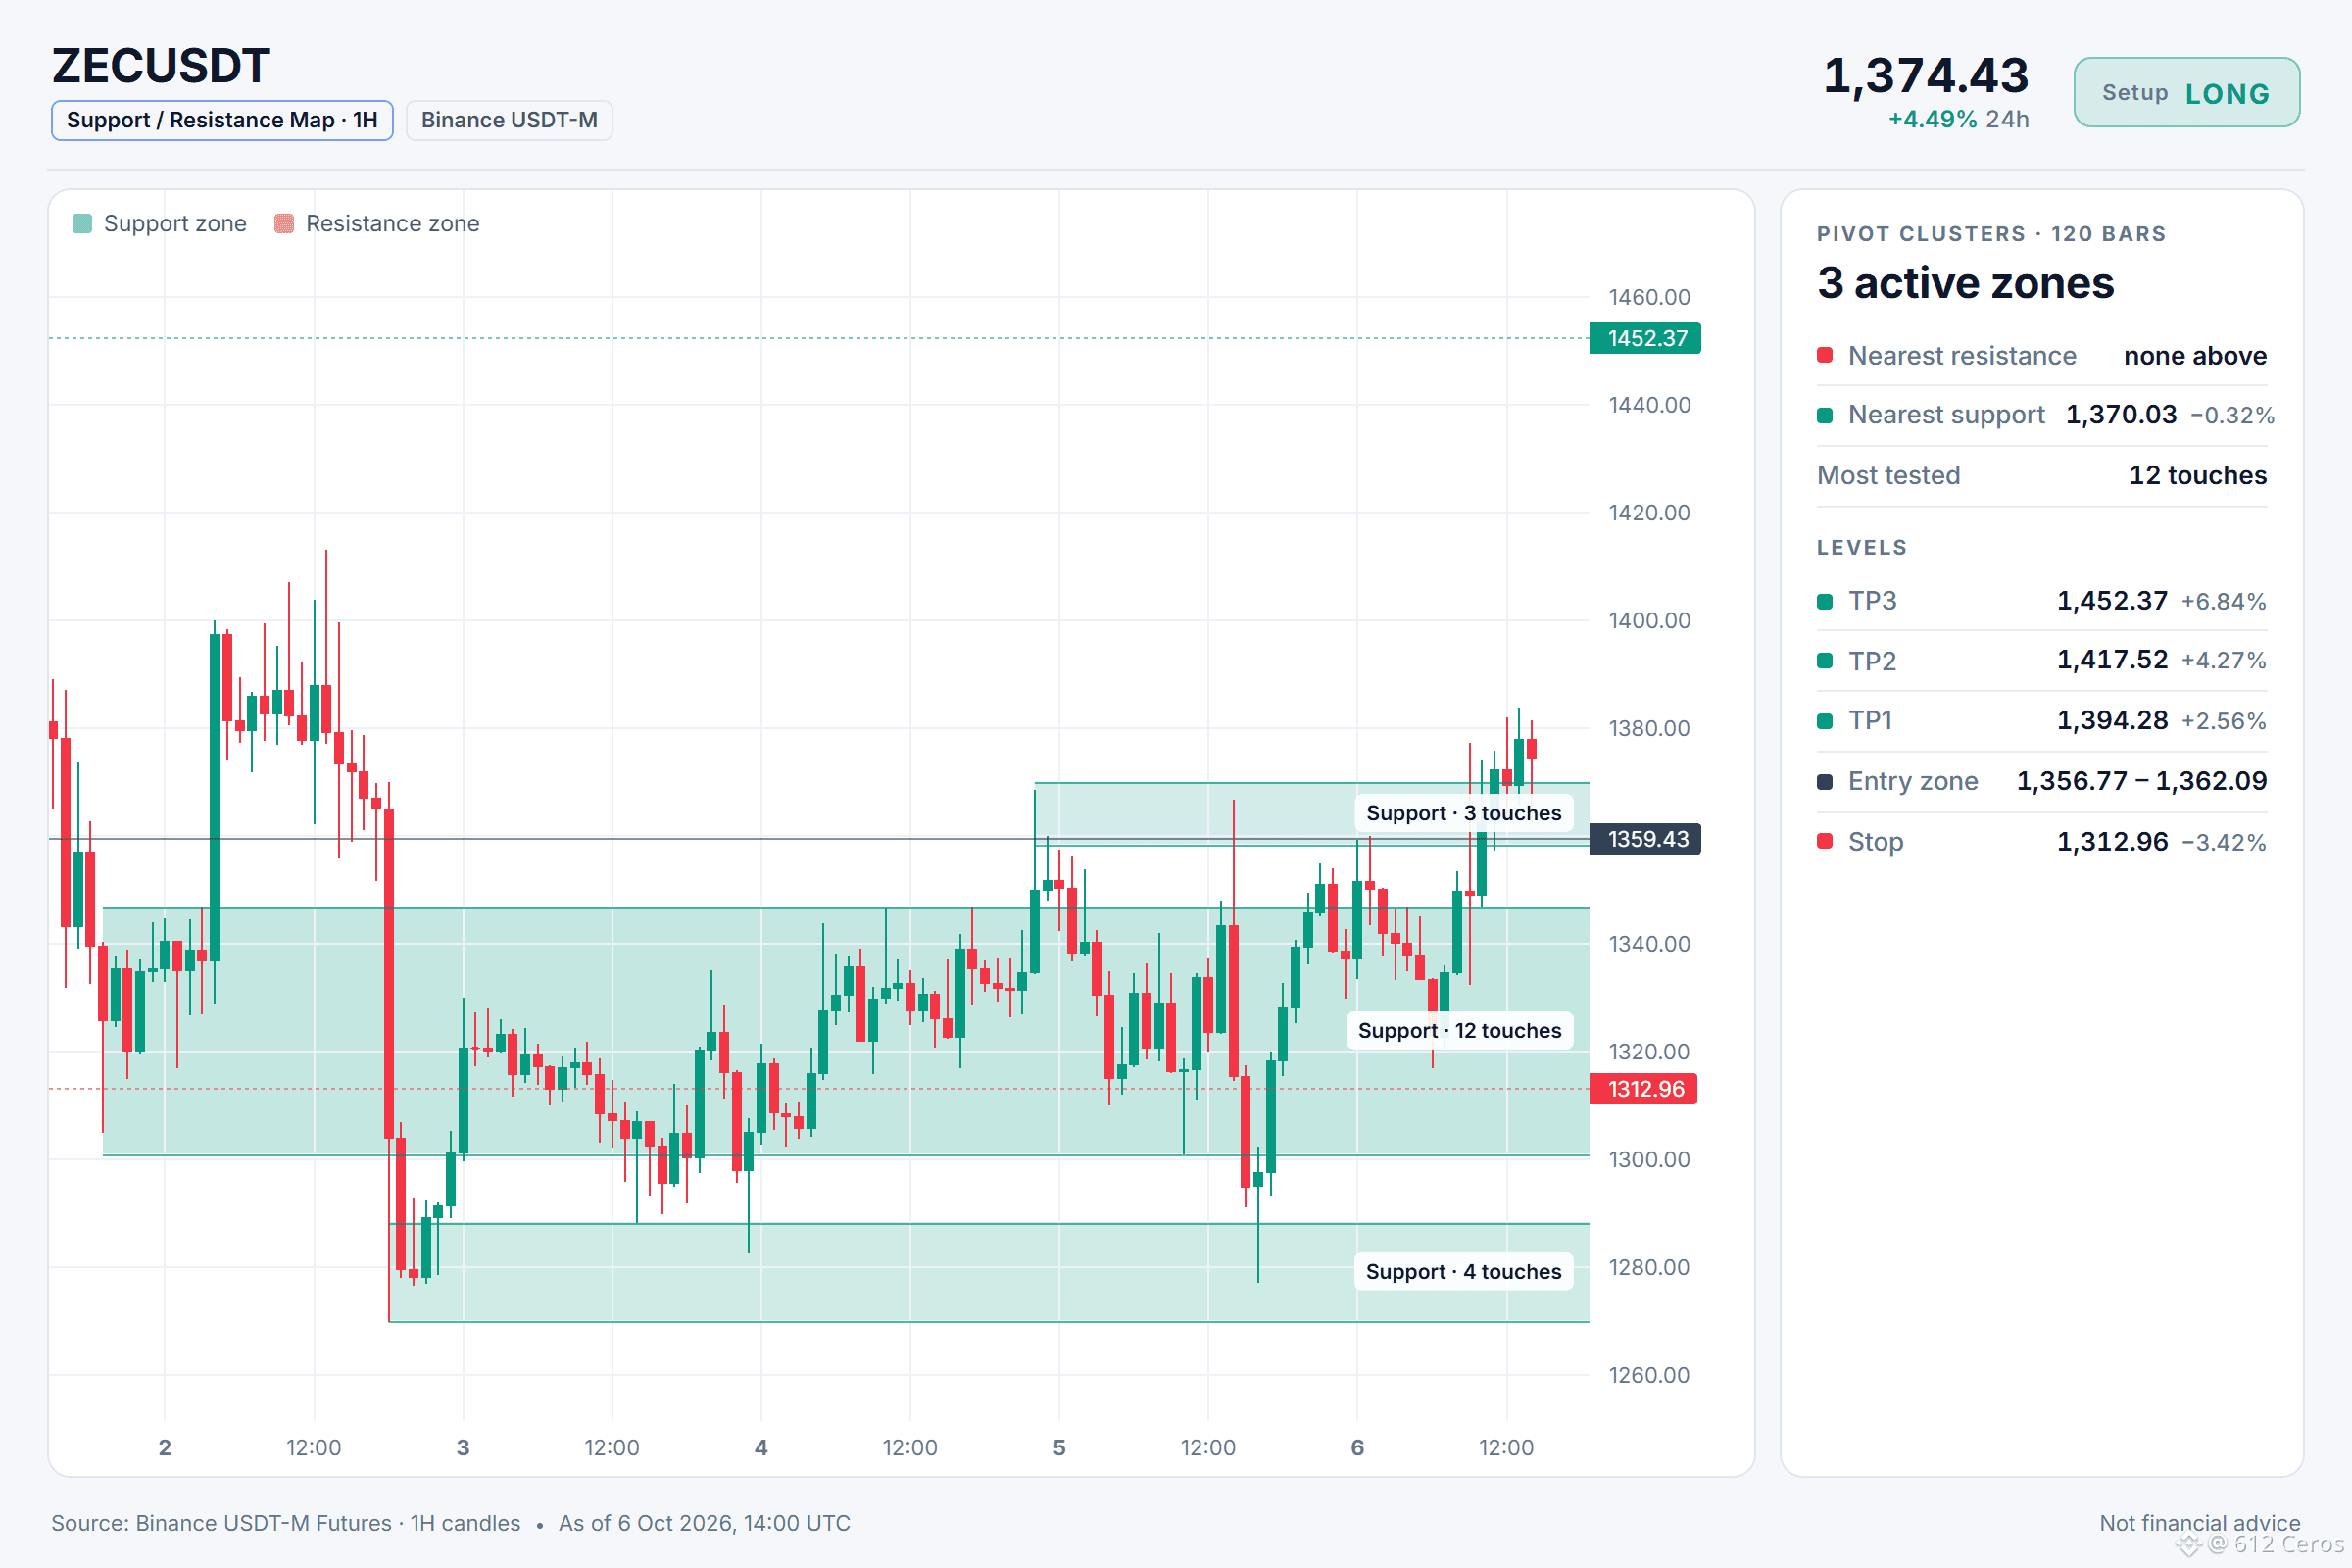
🟢 شراء طويل $ZEC /USDT: التوقع أن يرتفع السعر
الاتجاه: شراء طويل · ميل للصعود
الدخول: 1356.77 – 1362.09
الهدف 1: 1394.28 (+2.6%)
الهدف 2: 1417.52 (+4.3%)
الهدف 3: 1452.37 (+6.8%)
وقف الخسارة: 1312.96 (-3.4%)
الخطة: ادخل ضمن النطاق فقط، وخذ نصف الكمية عند الهدف 1، ثم انقل وقف الخسارة إلى سعر الدخول.
ملاحظة: درجة الثقة متوسطة فقط، لذا أبقِ حجم الصفقة صغيرًا.
لماذا الشراء الطويل؟ إشارة تميل إلى الشراء الطويل، 5 من أصل 12 إشارة تؤيدها، ولا توجد إشارات معاكسة، و7 لم تحسم موقفها.
• الاتجاه اليومي: السعر > EMA50 > EMA200، ترتيب صعودي → الاتجاه العام صاعد
• قوة الاتجاه (ADX/DI، 15 دقيقة): ADX عند 38.2 والمشترون يسيطرون (DI+ عند 19.0 مقابل DI− عند 14.7) → المشترون يقودون الحركة
• مؤشر RSI على إطار 4 ساعات: 55.2، زخم صعودي (فوق 55) → الزخم في صالح المشترين
س: لماذا الشراء الطويل رغم أن اتجاه إطار 4 ساعات متباين؟
ج: الاتجاه اليومي صعودي، والسعر أعلى من EMA50 وEMA200، ما يشير إلى اتجاه صاعد.
س: متى تصبح هذه الصفقة غير صالحة؟
ج: الإغلاق دون 1312.96 يعني أن صفقة الشراء الطويل لم تعد صالحة.
ما المستوى الذي قد يدفعك إلى اتخاذ الجهة المقابلة في ZEC هنا؟
الصفقة كاملة موضحة على الرسم البياني أدناه.
{future}(ZECUSDT)
📲 هل تريد المزيد من أحدث إشاراتي؟ انضم إليّ هنا:
[https://app.binance.com/uni-qr/D26WbL9t](https://app.binance.com/uni-qr/D26WbL9t)
⚠️ هذا تحليل شخصي للسوق فقط. ليس نصيحة مالية — أدر المخاطر بنفسك وأجرِ بحثك الخاص.
محتوى تعليمي، وليس نصيحة استثمارية أو توصية بشراء أي أصل أو بيعه أو إيداعه أو سحبه. لا توجد إعلانات مدفوعة أو روابط إحالة/تسويق بالعمولة.
اخترق ZEC ترتيبًا صعوديًا على الإطار اليومي، والمشترون يسيطرون.
🟢 شراء طويل $ZEC /USDT: التوقع أن يرتفع السعر
الاتجاه: شراء طويل · ميل للصعود
الدخول: 1356.77 – 1362.09
الهدف 1: 1394.28 (+2.6%)
الهدف 2: 1417.52 (+4.3%)
الهدف 3: 1452.37 (+6.8%)
وقف الخسارة: 1312.96 (-3.4%)
الخطة: ادخل ضمن النطاق فقط، وخذ نصف الكمية عند الهدف 1، ثم انقل وقف الخسارة إلى سعر الدخول.
ملاحظة: درجة الثقة متوسطة فقط، لذا أبقِ حجم الصفقة صغيرًا.
لماذا الشراء الطويل؟ إشارة تميل إلى الشراء الطويل، 5 من أصل 12 إشارة تؤيدها، ولا توجد إشارات معاكسة، و7 لم تحسم موقفها.
• الاتجاه اليومي: السعر > EMA50 > EMA200، ترتيب صعودي → الاتجاه العام صاعد
• قوة الاتجاه (ADX/DI، 15 دقيقة): ADX عند 38.2 والمشترون يسيطرون (DI+ عند 19.0 مقابل DI− عند 14.7) → المشترون يقودون الحركة
• مؤشر RSI على إطار 4 ساعات: 55.2، زخم صعودي (فوق 55) → الزخم في صالح المشترين
س: لماذا الشراء الطويل رغم أن اتجاه إطار 4 ساعات متباين؟
ج: الاتجاه اليومي صعودي، والسعر أعلى من EMA50 وEMA200، ما يشير إلى اتجاه صاعد.
س: متى تصبح هذه الصفقة غير صالحة؟
ج: الإغلاق دون 1312.96 يعني أن صفقة الشراء الطويل لم تعد صالحة.
ما المستوى الذي قد يدفعك إلى اتخاذ الجهة المقابلة في ZEC هنا؟
الصفقة كاملة موضحة على الرسم البياني أدناه.
📲 هل تريد المزيد من أحدث إشاراتي؟ انضم إليّ هنا:
https://app.binance.com/uni-qr/D26WbL9t
⚠️ هذا تحليل شخصي للسوق فقط. ليس نصيحة مالية — أدر المخاطر بنفسك وأجرِ بحثك الخاص.
محتوى تعليمي، وليس نصيحة استثمارية أو توصية بشراء أي أصل أو بيعه أو إيداعه أو سحبه. لا توجد إعلانات مدفوعة أو روابط إحالة/تسويق بالعمولة.
🟢 شراء طويل $ZEC /USDT: التوقع أن يرتفع السعر
الاتجاه: شراء طويل · ميل للصعود
الدخول: 1356.77 – 1362.09
الهدف 1: 1394.28 (+2.6%)
الهدف 2: 1417.52 (+4.3%)
الهدف 3: 1452.37 (+6.8%)
وقف الخسارة: 1312.96 (-3.4%)
الخطة: ادخل ضمن النطاق فقط، وخذ نصف الكمية عند الهدف 1، ثم انقل وقف الخسارة إلى سعر الدخول.
ملاحظة: درجة الثقة متوسطة فقط، لذا أبقِ حجم الصفقة صغيرًا.
لماذا الشراء الطويل؟ إشارة تميل إلى الشراء الطويل، 5 من أصل 12 إشارة تؤيدها، ولا توجد إشارات معاكسة، و7 لم تحسم موقفها.
• الاتجاه اليومي: السعر > EMA50 > EMA200، ترتيب صعودي → الاتجاه العام صاعد
• قوة الاتجاه (ADX/DI، 15 دقيقة): ADX عند 38.2 والمشترون يسيطرون (DI+ عند 19.0 مقابل DI− عند 14.7) → المشترون يقودون الحركة
• مؤشر RSI على إطار 4 ساعات: 55.2، زخم صعودي (فوق 55) → الزخم في صالح المشترين
س: لماذا الشراء الطويل رغم أن اتجاه إطار 4 ساعات متباين؟
ج: الاتجاه اليومي صعودي، والسعر أعلى من EMA50 وEMA200، ما يشير إلى اتجاه صاعد.
س: متى تصبح هذه الصفقة غير صالحة؟
ج: الإغلاق دون 1312.96 يعني أن صفقة الشراء الطويل لم تعد صالحة.
ما المستوى الذي قد يدفعك إلى اتخاذ الجهة المقابلة في ZEC هنا؟
الصفقة كاملة موضحة على الرسم البياني أدناه.
📲 هل تريد المزيد من أحدث إشاراتي؟ انضم إليّ هنا:
https://app.binance.com/uni-qr/D26WbL9t
⚠️ هذا تحليل شخصي للسوق فقط. ليس نصيحة مالية — أدر المخاطر بنفسك وأجرِ بحثك الخاص.
محتوى تعليمي، وليس نصيحة استثمارية أو توصية بشراء أي أصل أو بيعه أو إيداعه أو سحبه. لا توجد إعلانات مدفوعة أو روابط إحالة/تسويق بالعمولة.
1
516
·
--
صاعد
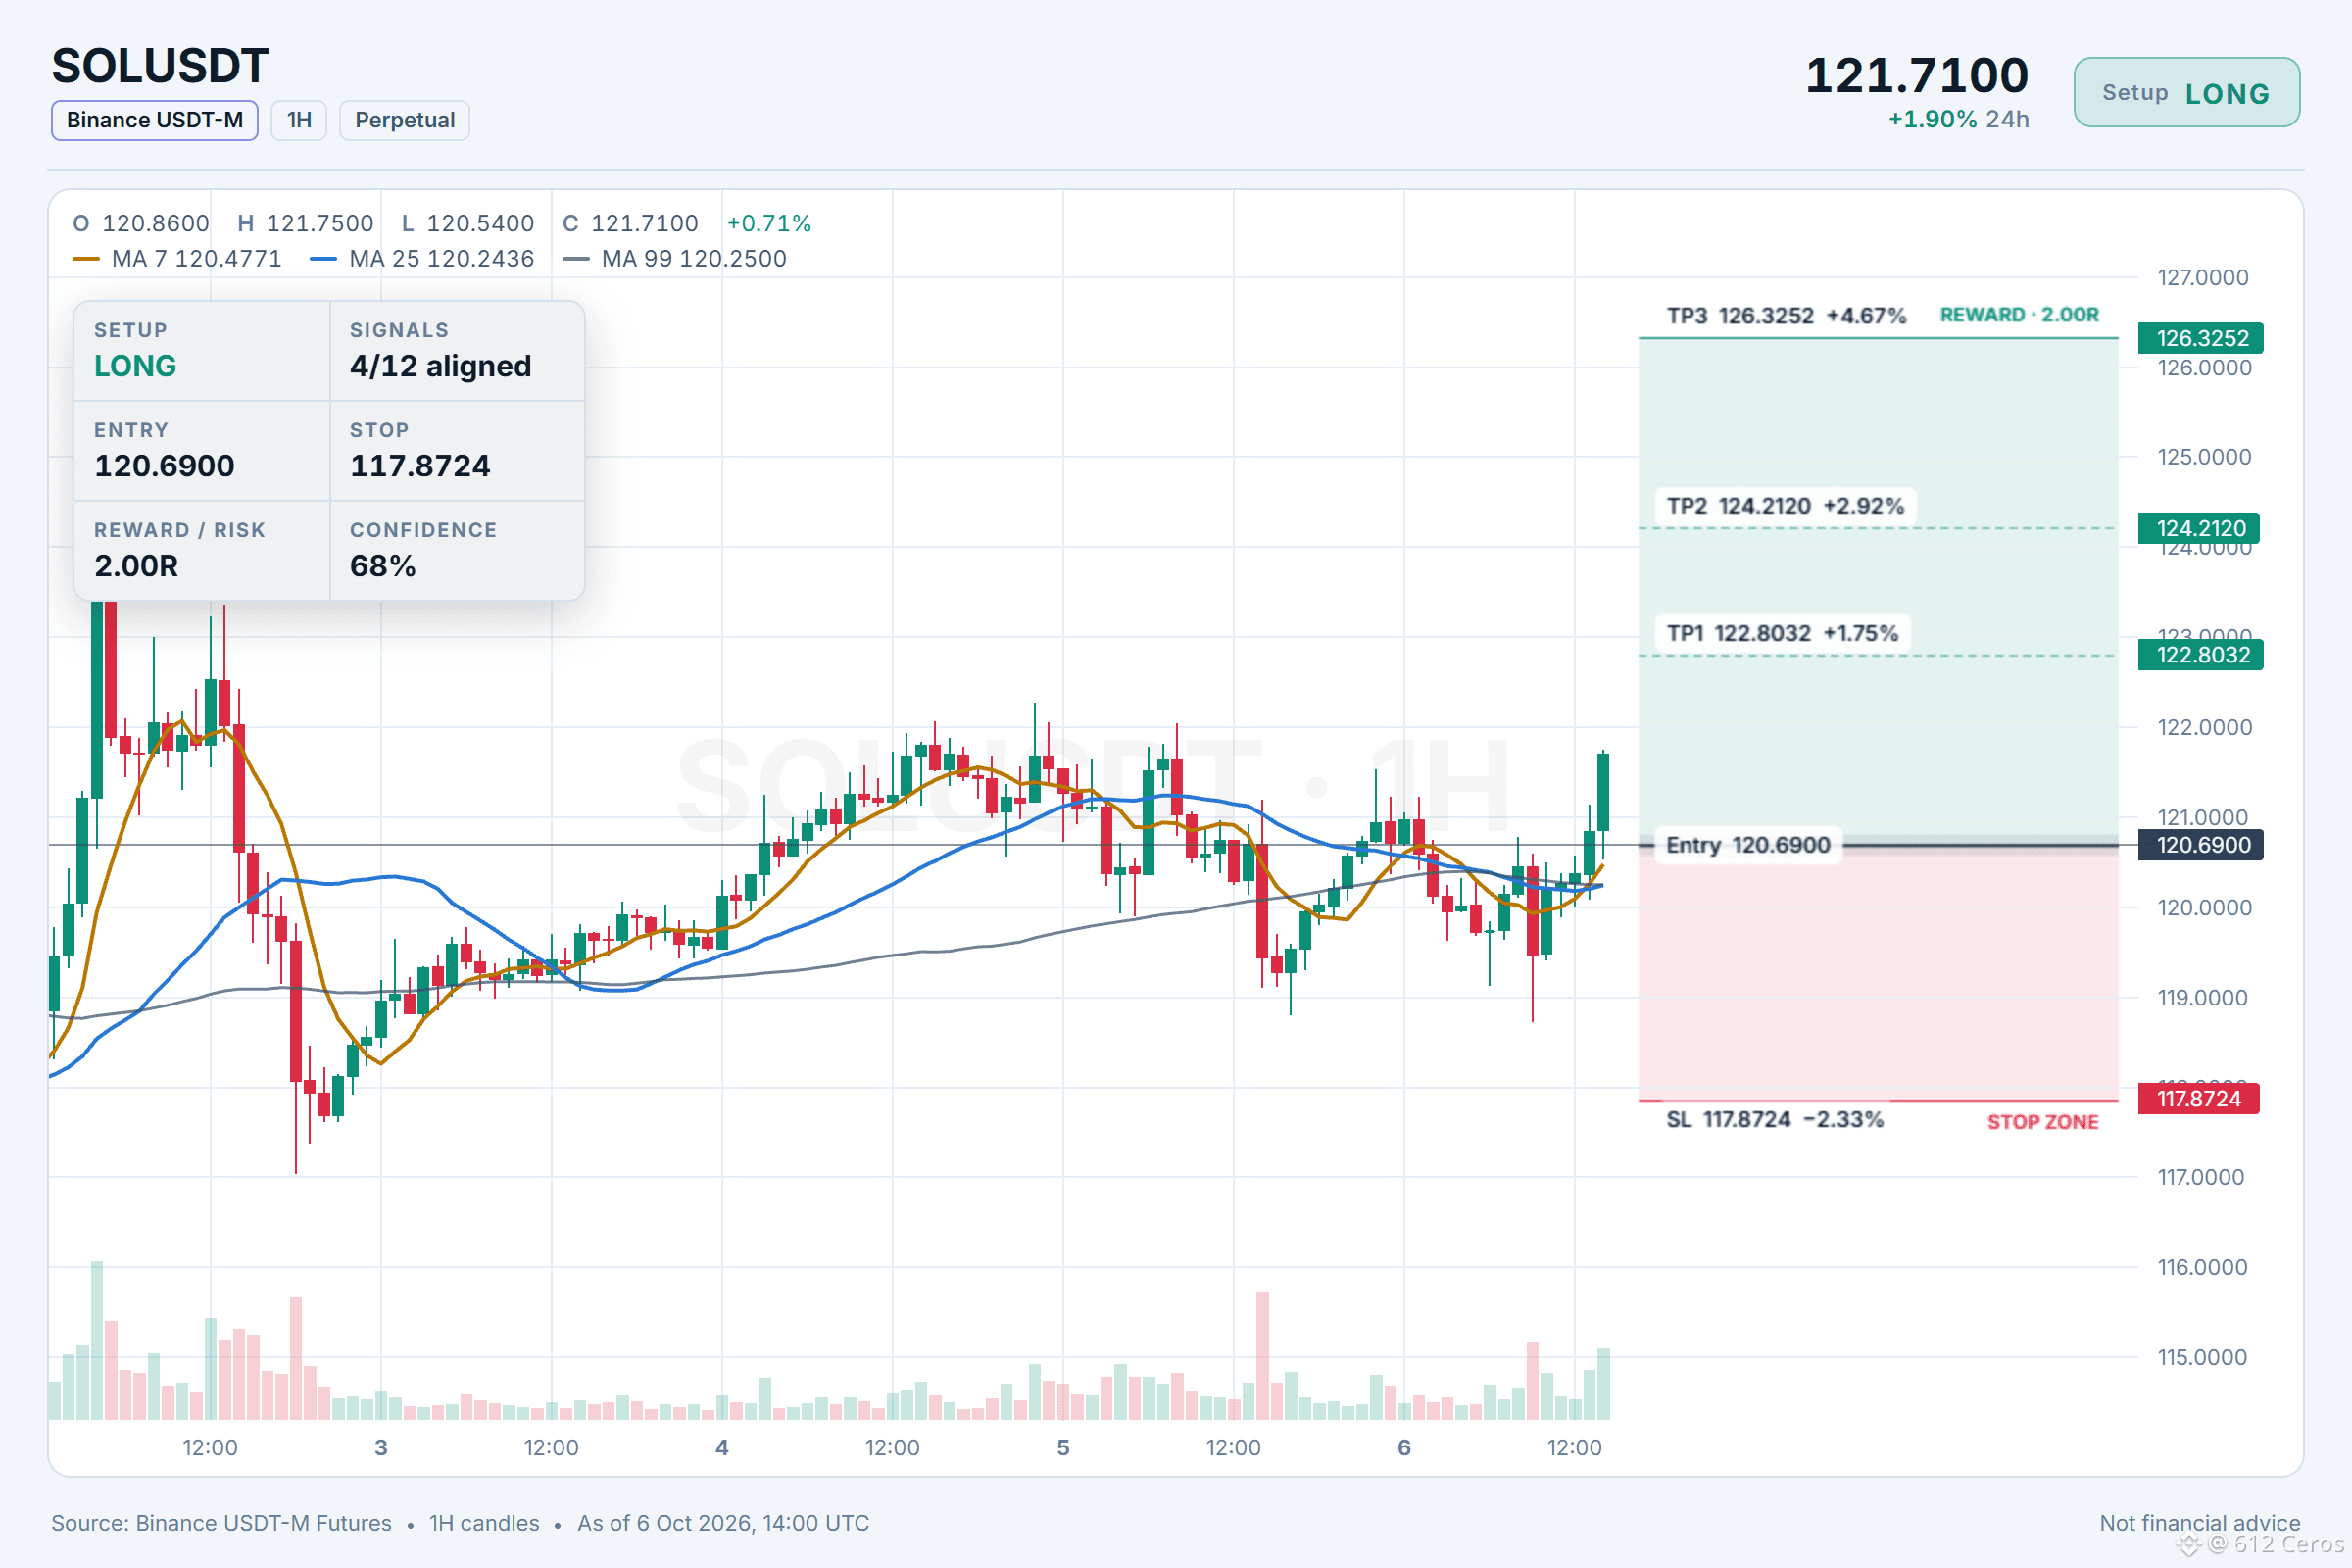
عملة SOL في اتجاه صاعد واضح على الإطارين اليومي و4 ساعات.
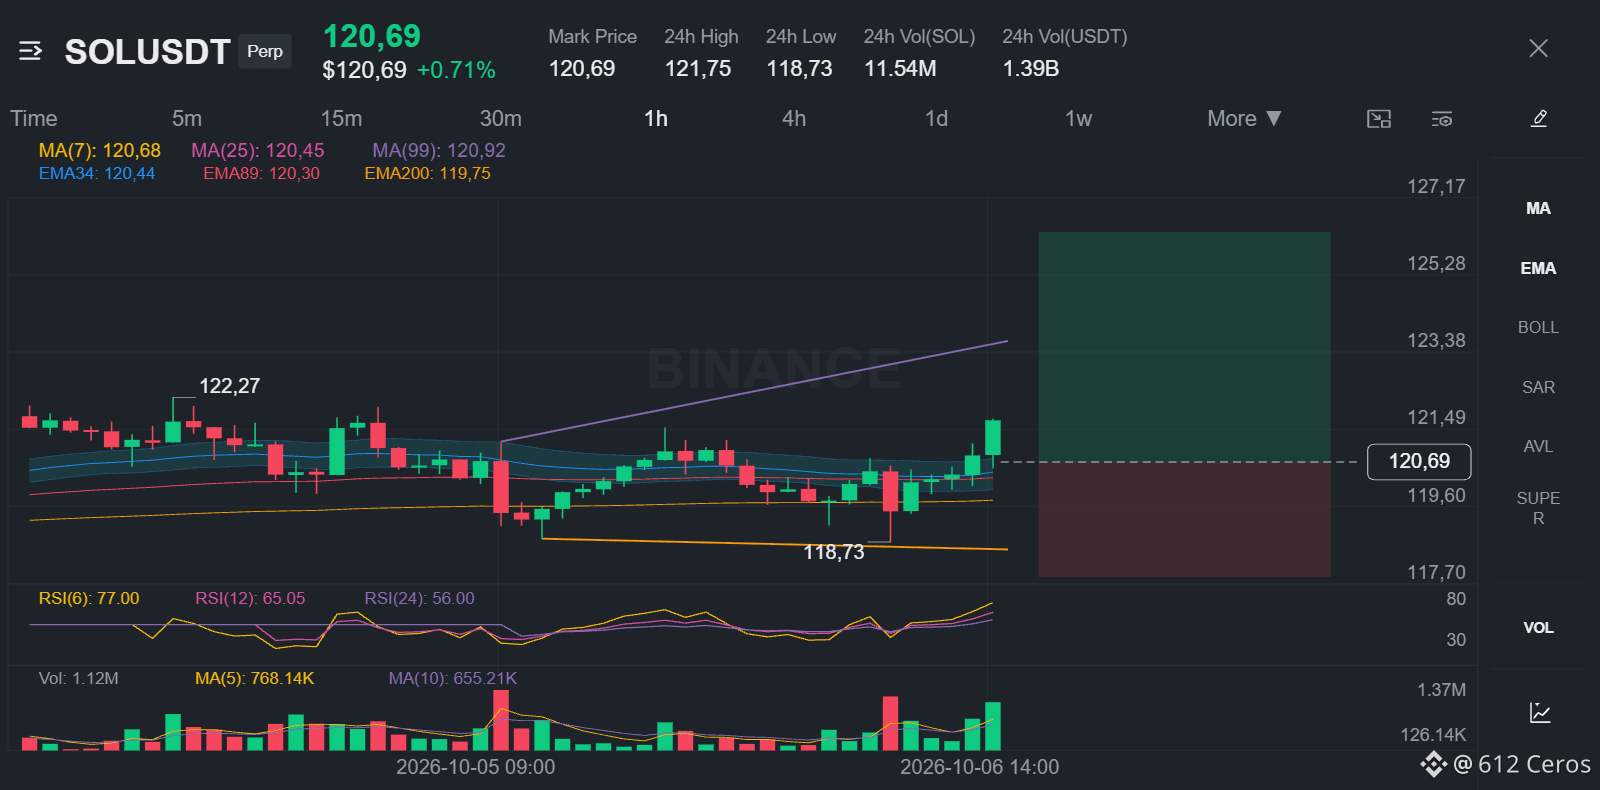
🟢 شراء $SOL /USDT: من المتوقع أن يرتفع السعر
الانحياز: شراء · ميل صعودي
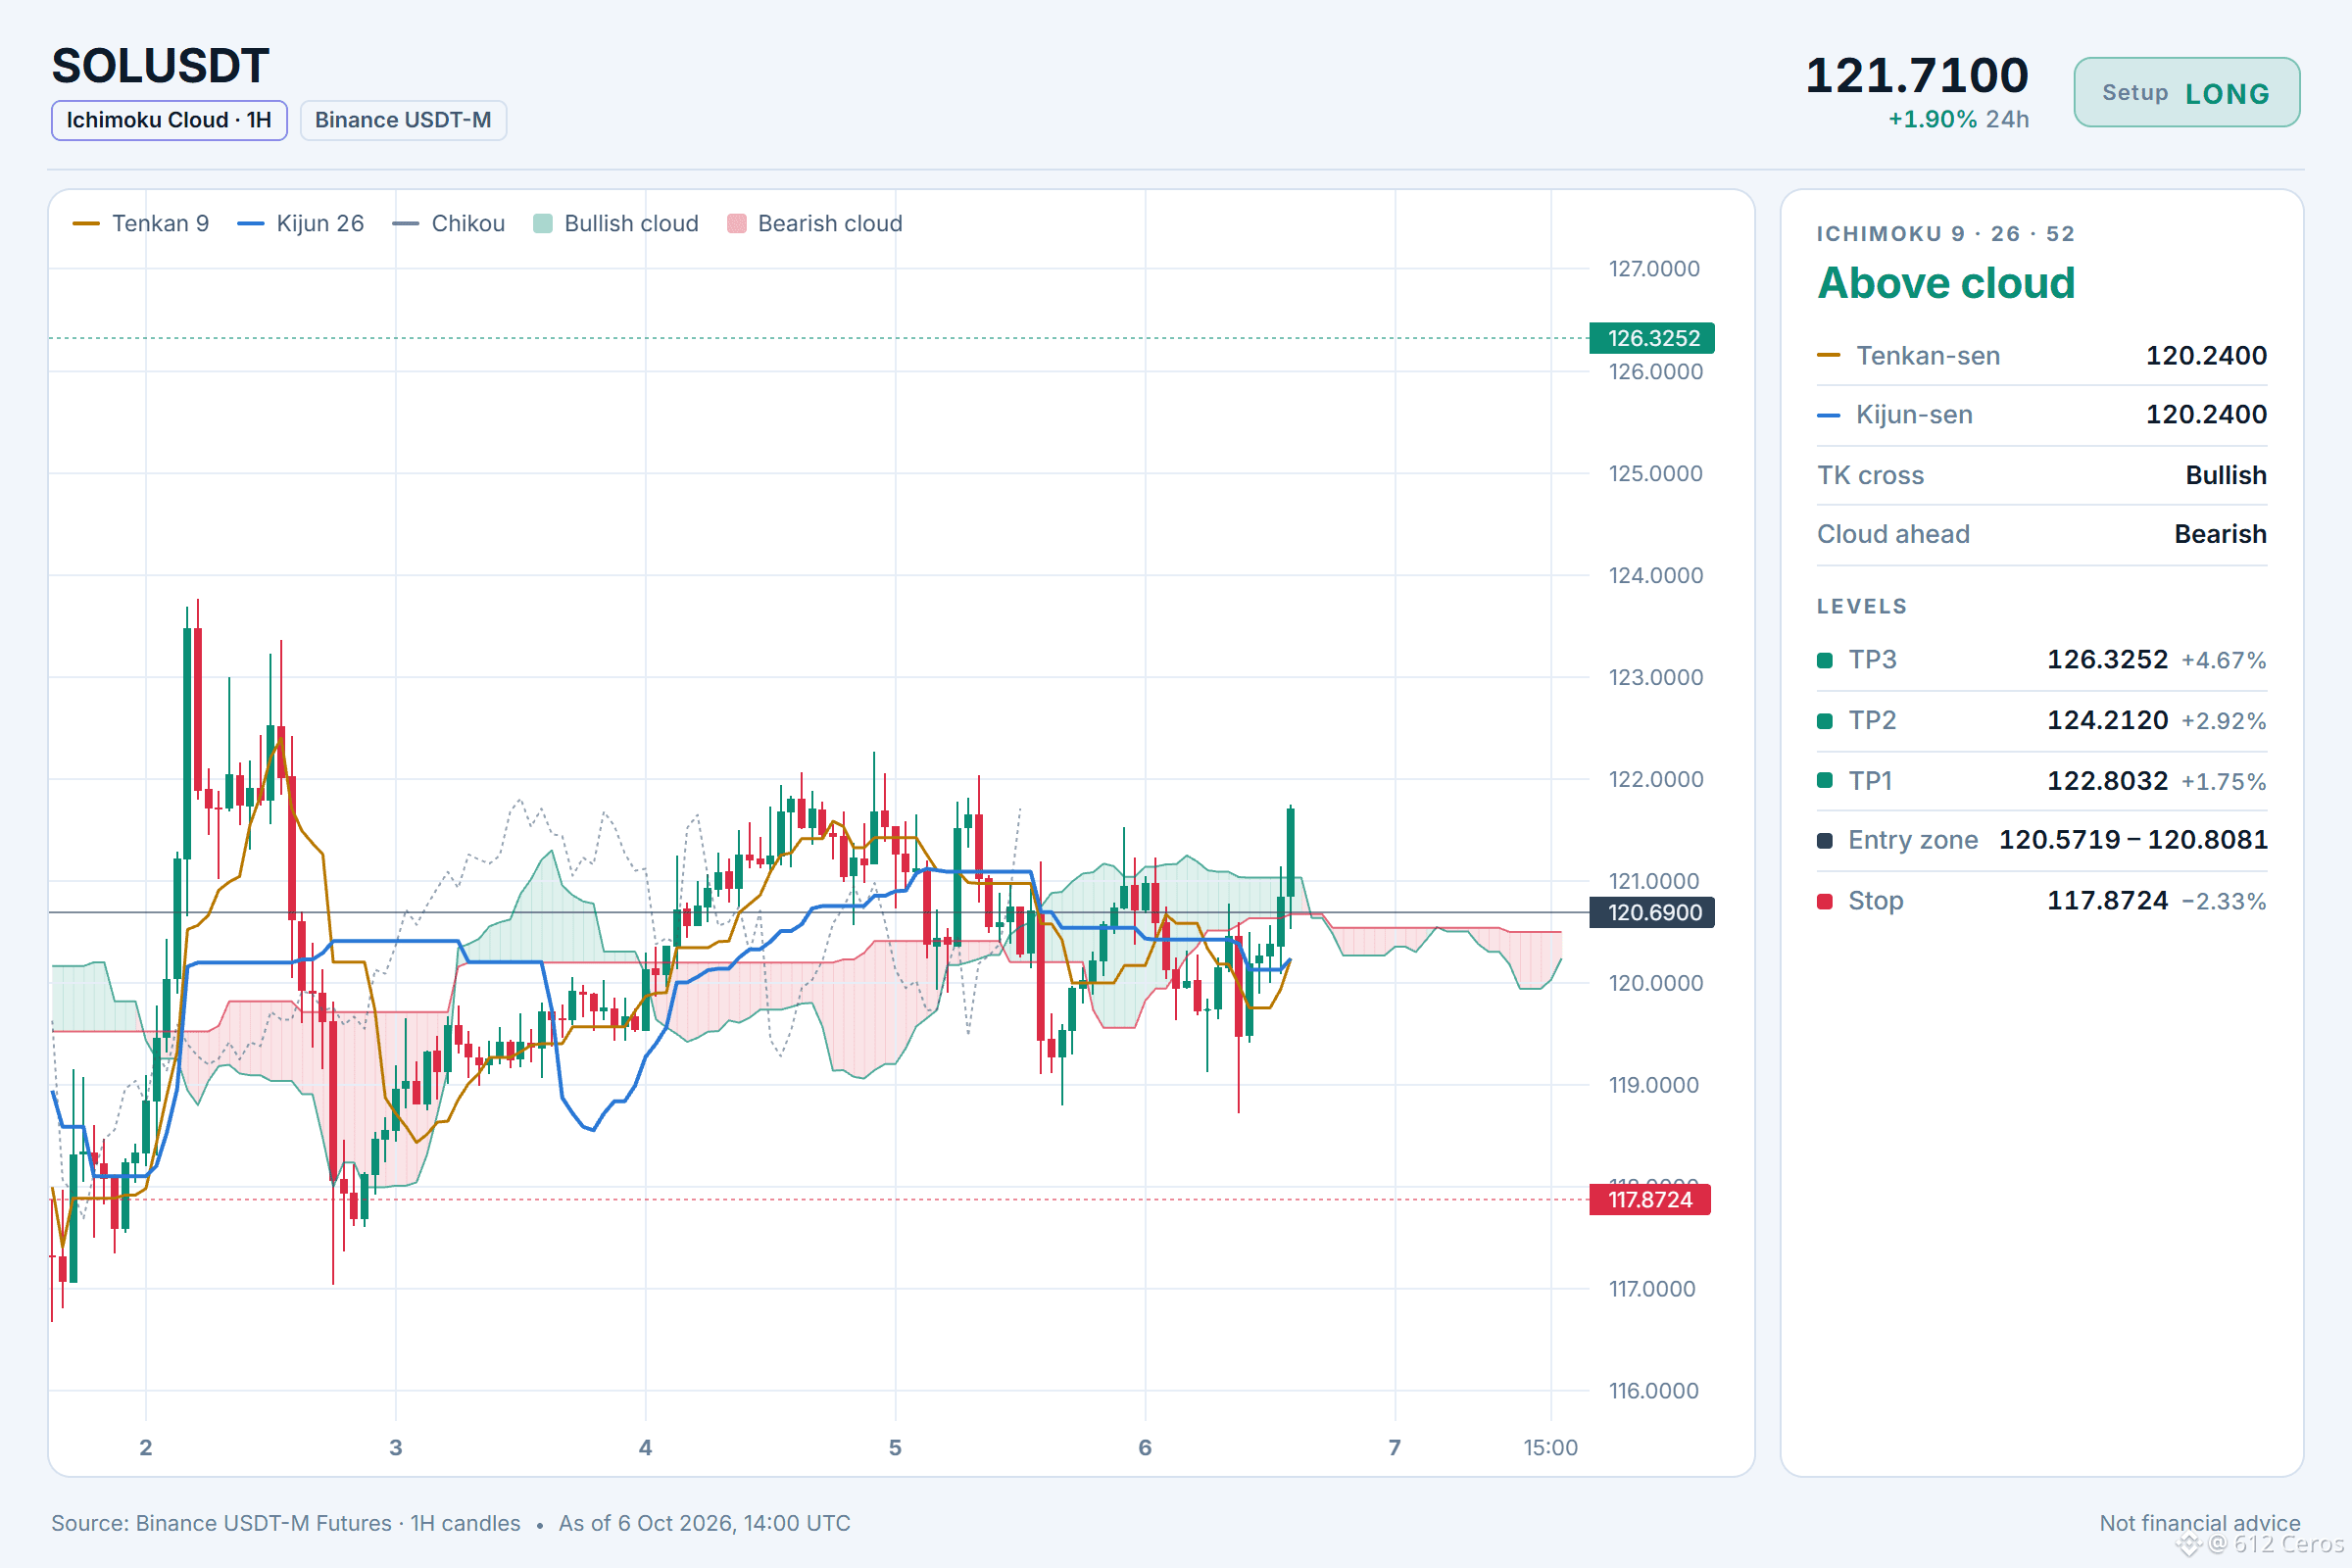
الدخول: 120.5719 – 120.8081
جني الأرباح 1: 122.8032 (+1.8%)
جني الأرباح 2: 124.2120 (+2.9%)
جني الأرباح 3: 126.3252 (+4.7%)
وقف الخسارة: 117.8724 (-2.3%)
الخطة: ادخل فقط ضمن النطاق، وخذ نصف الكمية عند جني الأرباح 1، ثم انقل وقف الخسارة إلى سعر الدخول.
ملاحظة: مستوى الثقة متوسط فحسب، لذا اجعل حجم الصفقة صغيرًا.
لماذا الشراء؟ إشارة تميل للصعود؛ تتفق 4/12 من الإشارات، ولا توجد إشارات معاكسة، و8 غير حاسمة.
• الاتجاه اليومي: السعر > EMA50 > EMA200، ترتيب صعودي → الاتجاه العام صاعد
• اتجاه 4 ساعات: السعر > EMA50 > EMA200، ترتيب صعودي → اتجاه التأرجح صاعد
• اتجاه ساعة واحدة: السعر > EMA50 > EMA200، ترتيب صعودي → الاتجاه قصير الأجل صاعد
لماذا الآن؟
الاتجاه اليومي صعودي، والسعر أعلى من المتوسطين الأسيين 50 و200. واتجاه 4 ساعات صعودي أيضًا، مع الترتيب نفسه للمتوسطات الأسية. مؤشر RSI على إطار الساعة عند 55، ما يشير إلى أن المشترين يمتلكون الزخم.
أين ستجني الأرباح في صفقة شراء مع مستوى إبطال عند 117.8724؟
المخطط مع جميع المستويات أدناه.
{future}(SOLUSDT)
📲 هل تريد المزيد من أحدث إشاراتي؟ انضم إليّ هنا:
[https://app.binance.com/uni-qr/D26WbL9t](https://app.binance.com/uni-qr/D26WbL9t)
⚠️ هذا تحليل شخصي للسوق فقط. ليس نصيحة مالية — أدر المخاطر وأجرِ بحثك بنفسك.
محتوى تعليمي، وليس نصيحة استثمارية أو توصية بشراء أي أصل أو بيعه أو إيداعه أو سحبه. لا توجد أي عروض ترويجية مدفوعة أو روابط إحالة/عمولة.
عملة SOL في اتجاه صاعد واضح على الإطارين اليومي و4 ساعات.
🟢 شراء $SOL /USDT: من المتوقع أن يرتفع السعر
الانحياز: شراء · ميل صعودي
الدخول: 120.5719 – 120.8081
جني الأرباح 1: 122.8032 (+1.8%)
جني الأرباح 2: 124.2120 (+2.9%)
جني الأرباح 3: 126.3252 (+4.7%)
وقف الخسارة: 117.8724 (-2.3%)
الخطة: ادخل فقط ضمن النطاق، وخذ نصف الكمية عند جني الأرباح 1، ثم انقل وقف الخسارة إلى سعر الدخول.
ملاحظة: مستوى الثقة متوسط فحسب، لذا اجعل حجم الصفقة صغيرًا.
لماذا الشراء؟ إشارة تميل للصعود؛ تتفق 4/12 من الإشارات، ولا توجد إشارات معاكسة، و8 غير حاسمة.
• الاتجاه اليومي: السعر > EMA50 > EMA200، ترتيب صعودي → الاتجاه العام صاعد
• اتجاه 4 ساعات: السعر > EMA50 > EMA200، ترتيب صعودي → اتجاه التأرجح صاعد
• اتجاه ساعة واحدة: السعر > EMA50 > EMA200، ترتيب صعودي → الاتجاه قصير الأجل صاعد
لماذا الآن؟
الاتجاه اليومي صعودي، والسعر أعلى من المتوسطين الأسيين 50 و200. واتجاه 4 ساعات صعودي أيضًا، مع الترتيب نفسه للمتوسطات الأسية. مؤشر RSI على إطار الساعة عند 55، ما يشير إلى أن المشترين يمتلكون الزخم.
أين ستجني الأرباح في صفقة شراء مع مستوى إبطال عند 117.8724؟
المخطط مع جميع المستويات أدناه.
📲 هل تريد المزيد من أحدث إشاراتي؟ انضم إليّ هنا:
https://app.binance.com/uni-qr/D26WbL9t
⚠️ هذا تحليل شخصي للسوق فقط. ليس نصيحة مالية — أدر المخاطر وأجرِ بحثك بنفسك.
محتوى تعليمي، وليس نصيحة استثمارية أو توصية بشراء أي أصل أو بيعه أو إيداعه أو سحبه. لا توجد أي عروض ترويجية مدفوعة أو روابط إحالة/عمولة.
🟢 شراء $SOL /USDT: من المتوقع أن يرتفع السعر
الانحياز: شراء · ميل صعودي
الدخول: 120.5719 – 120.8081
جني الأرباح 1: 122.8032 (+1.8%)
جني الأرباح 2: 124.2120 (+2.9%)
جني الأرباح 3: 126.3252 (+4.7%)
وقف الخسارة: 117.8724 (-2.3%)
الخطة: ادخل فقط ضمن النطاق، وخذ نصف الكمية عند جني الأرباح 1، ثم انقل وقف الخسارة إلى سعر الدخول.
ملاحظة: مستوى الثقة متوسط فحسب، لذا اجعل حجم الصفقة صغيرًا.
لماذا الشراء؟ إشارة تميل للصعود؛ تتفق 4/12 من الإشارات، ولا توجد إشارات معاكسة، و8 غير حاسمة.
• الاتجاه اليومي: السعر > EMA50 > EMA200، ترتيب صعودي → الاتجاه العام صاعد
• اتجاه 4 ساعات: السعر > EMA50 > EMA200، ترتيب صعودي → اتجاه التأرجح صاعد
• اتجاه ساعة واحدة: السعر > EMA50 > EMA200، ترتيب صعودي → الاتجاه قصير الأجل صاعد
لماذا الآن؟
الاتجاه اليومي صعودي، والسعر أعلى من المتوسطين الأسيين 50 و200. واتجاه 4 ساعات صعودي أيضًا، مع الترتيب نفسه للمتوسطات الأسية. مؤشر RSI على إطار الساعة عند 55، ما يشير إلى أن المشترين يمتلكون الزخم.
أين ستجني الأرباح في صفقة شراء مع مستوى إبطال عند 117.8724؟
المخطط مع جميع المستويات أدناه.
📲 هل تريد المزيد من أحدث إشاراتي؟ انضم إليّ هنا:
https://app.binance.com/uni-qr/D26WbL9t
⚠️ هذا تحليل شخصي للسوق فقط. ليس نصيحة مالية — أدر المخاطر وأجرِ بحثك بنفسك.
محتوى تعليمي، وليس نصيحة استثمارية أو توصية بشراء أي أصل أو بيعه أو إيداعه أو سحبه. لا توجد أي عروض ترويجية مدفوعة أو روابط إحالة/عمولة.
408
·
--
صاعد
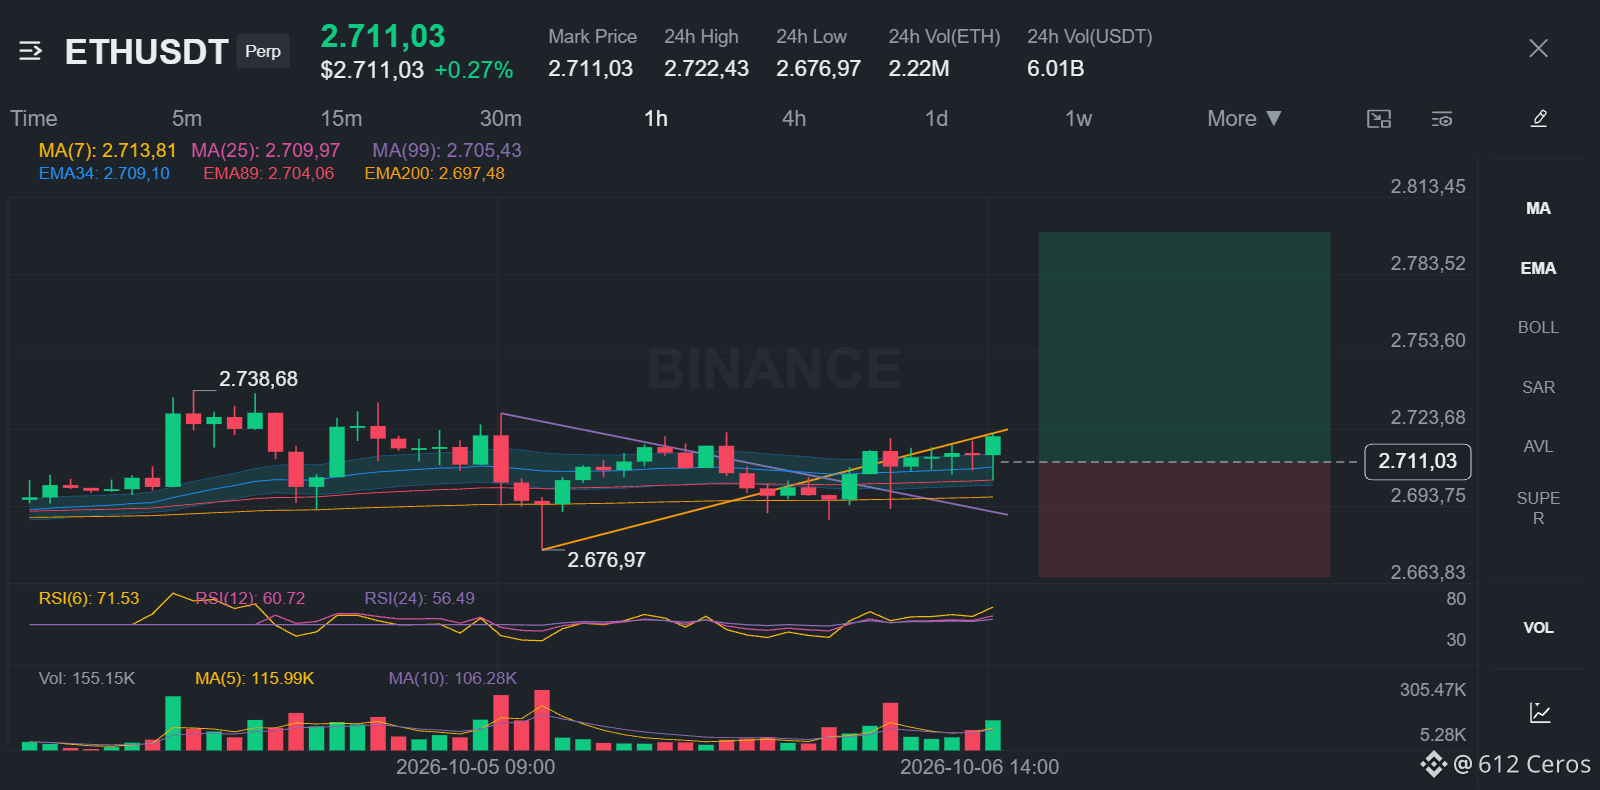
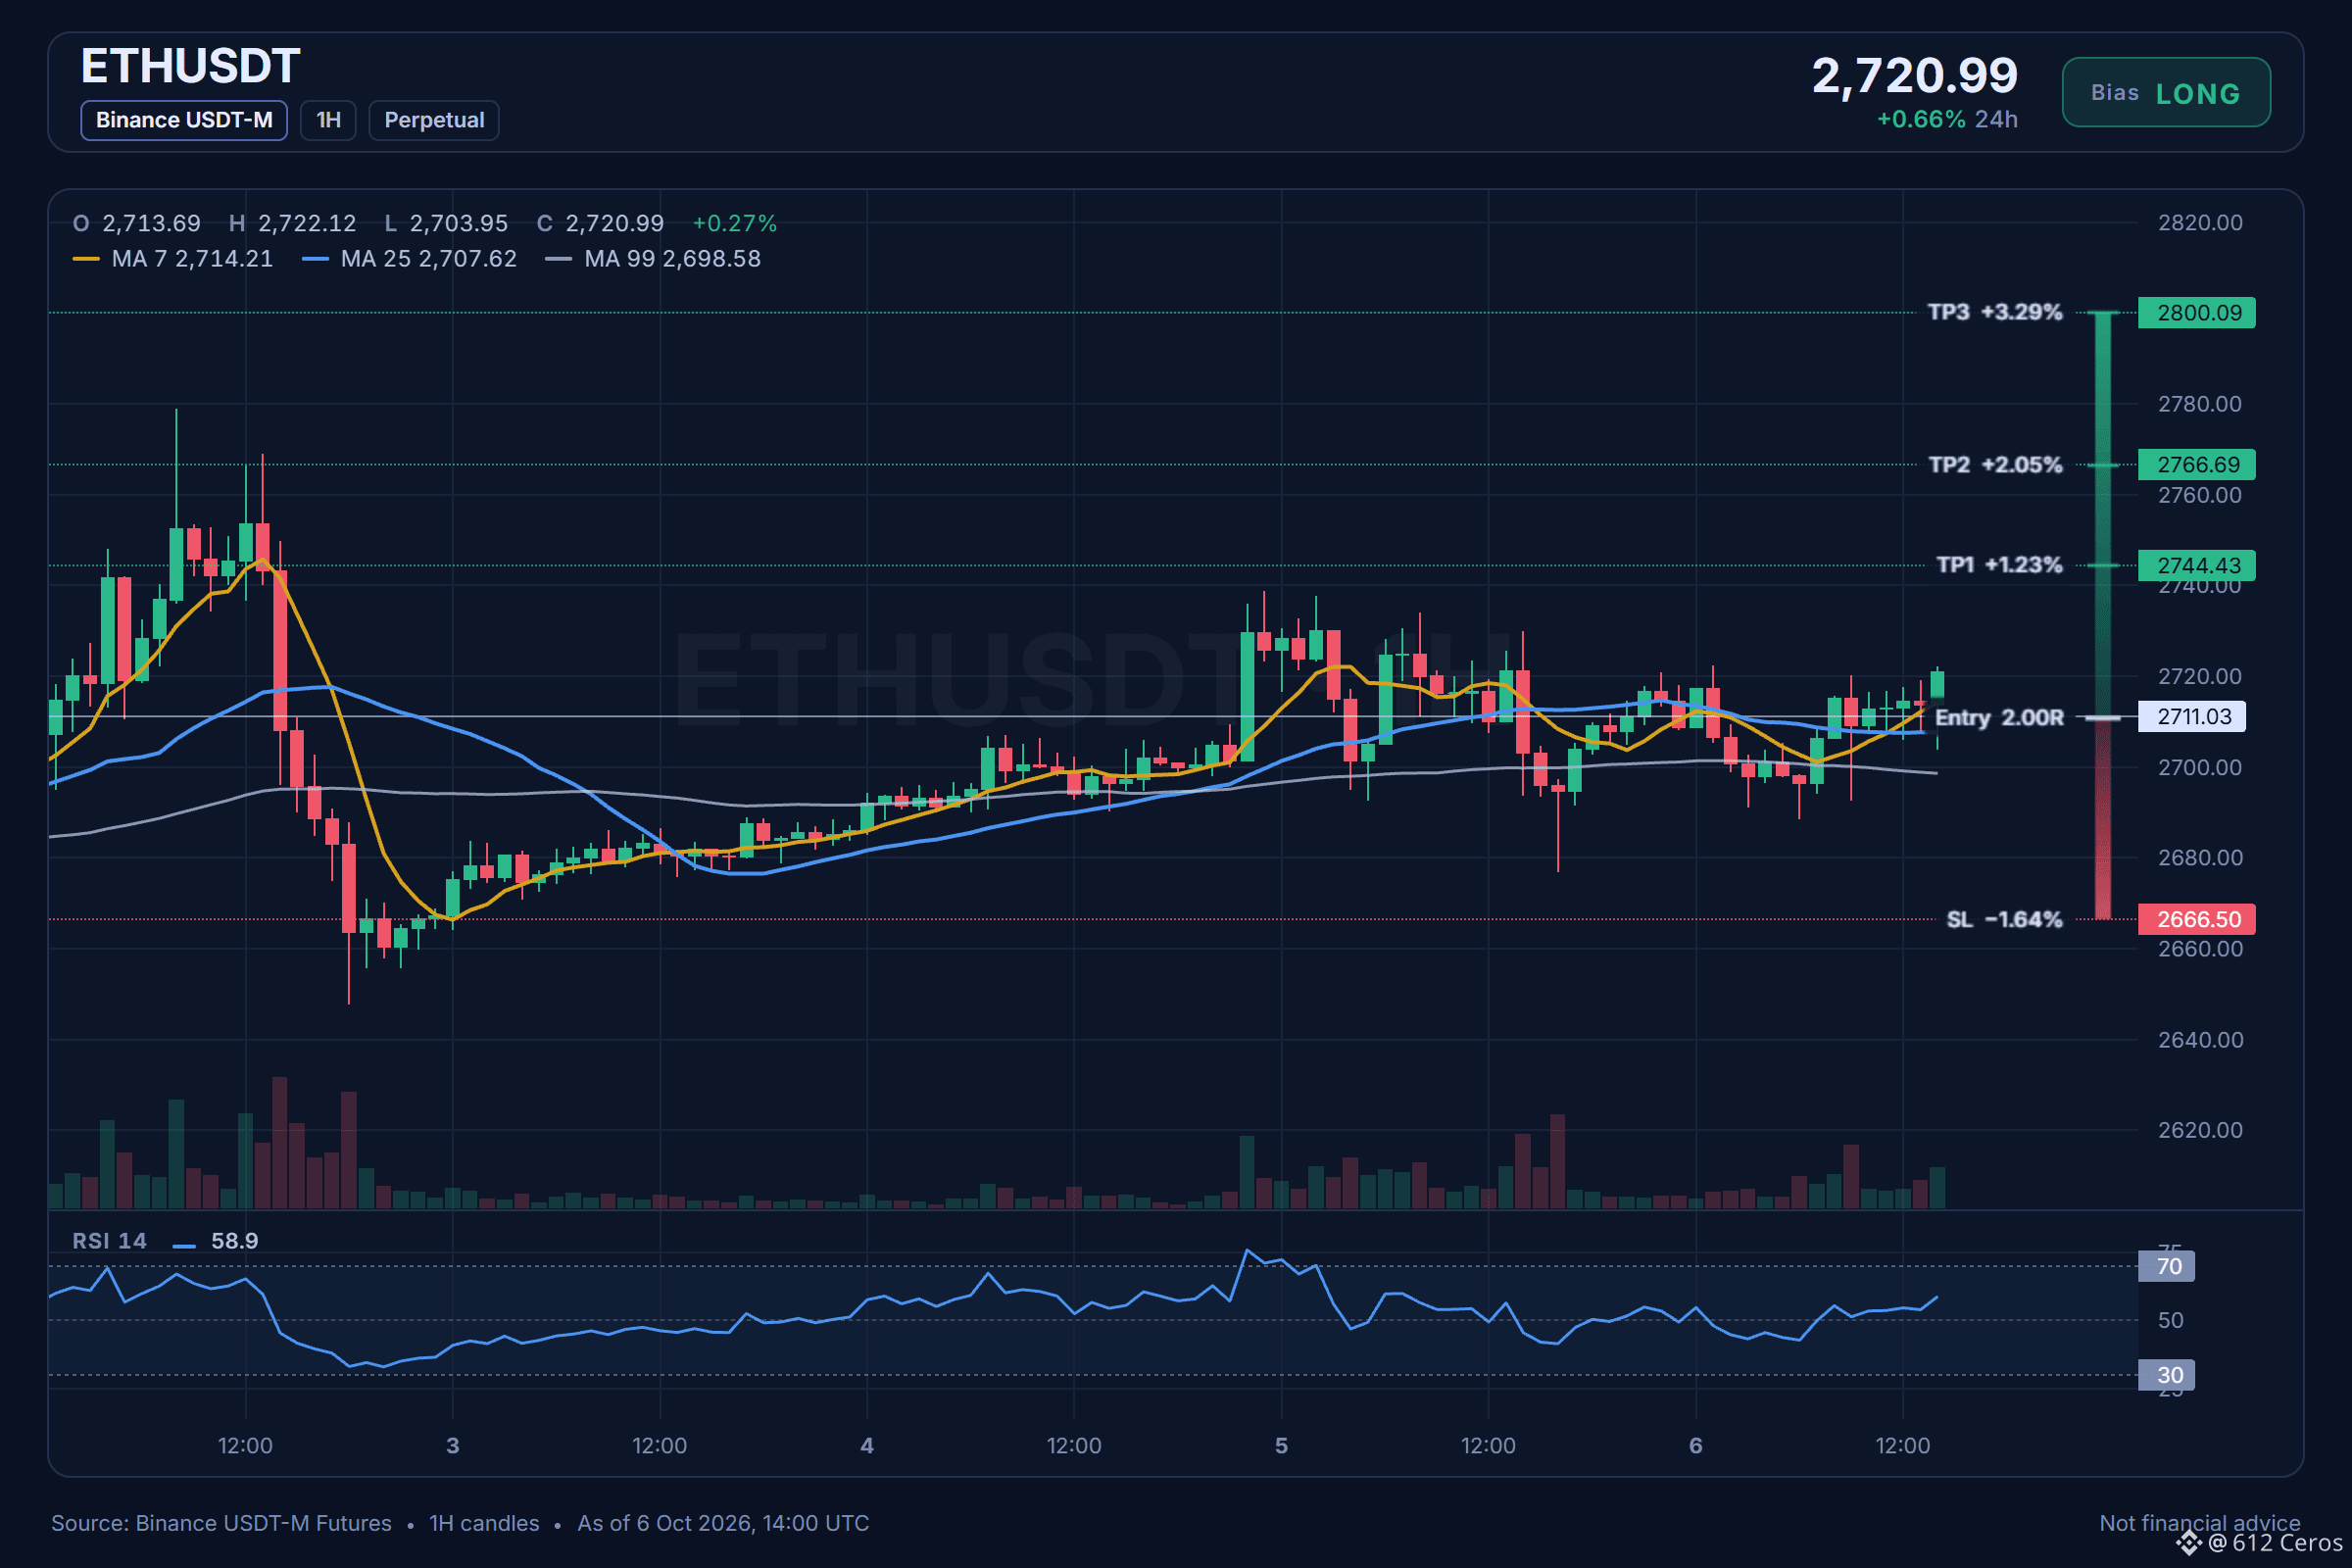
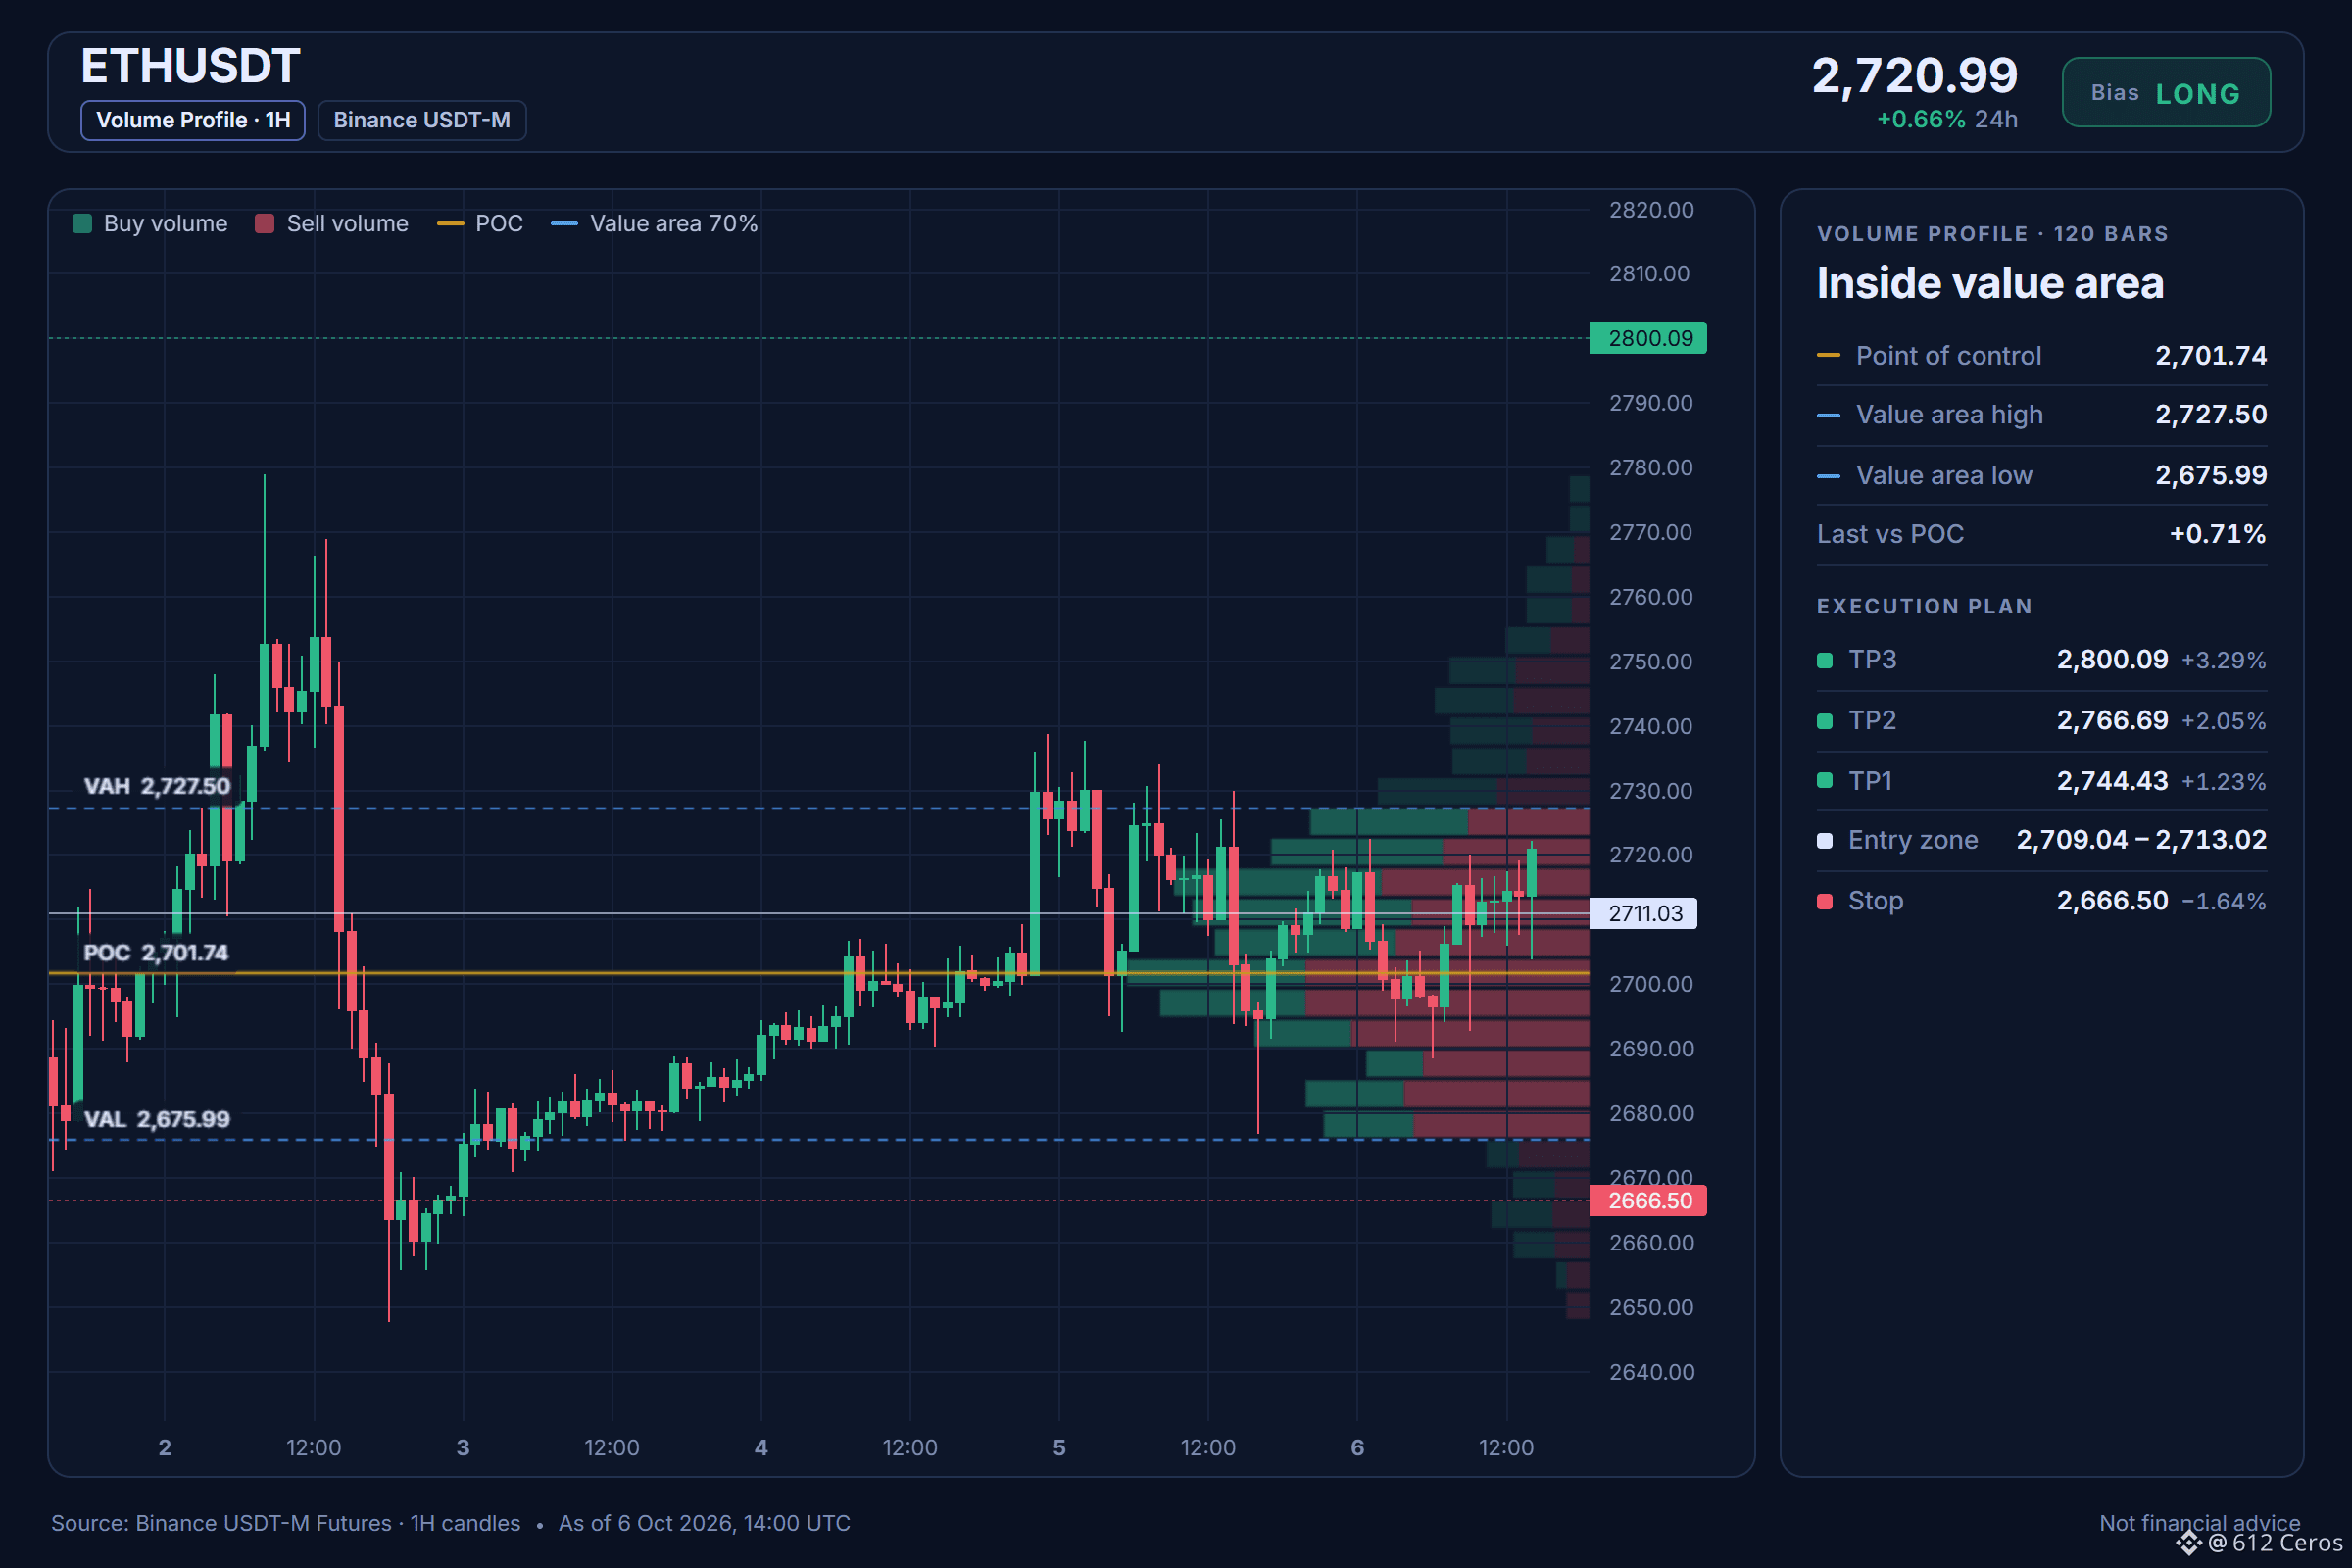
إيثيريوم ليس هبوطياً بالقدر الذي تدّعيه العناوين
🟢 شراء طويل $ETH /USDT: توقّع ارتفاع السعر
التوجّه: شراء طويل · ميل صعودي
الدخول: 2709.04 – 2713.02
الهدف 1: 2744.43 (+1.2%)
الهدف 2: 2766.69 (+2.1%)
الهدف 3: 2800.09 (+3.3%)
وقف الخسارة: 2666.50 (-1.6%)
الخطة: ادخل فقط ضمن النطاق، وبِع نصف الكمية عند الهدف 1، ثم حرّك وقف الخسارة إلى سعر الدخول.
ملاحظة: الثقة متوسطة فحسب، لذا أبقِ حجم الصفقة صغيراً.
لماذا الشراء الطويل؟ التوجّه يميل إلى الشراء الطويل؛ 4 من أصل 12 إشارة تؤيده، ولا تعارضه أي إشارة، فيما لم تحسم 8 إشارات موقفها.
• الاتجاه اليومي: السعر > EMA50 > EMA200، ترتيب صعودي → الاتجاه العام صاعد
• اتجاه 4 ساعات: السعر > EMA50 > EMA200، ترتيب صعودي → اتجاه التأرجح صاعد
• اتجاه ساعة واحدة: السعر > EMA50 > EMA200، ترتيب صعودي → الاتجاه قصير الأجل صاعد
ملاحظة في سجل التداول: ETH
أراقب ETH لأن الاتجاه اليومي واتجاه 4 ساعات صعوديان. أريد أن أرى السعر يصمد فوق EMA50 على إطار الساعة، مع إظهار RSI على إطار الساعة أن الزخم في صالح المشترين. يميل الإعداد إلى الشراء الطويل، ودرجة الثقة متوسطة. الاتجاه اليومي صعودي، وRSI على إطار الساعة عند 58.9، ما يعني أن المشترين يسيطرون على الزخم قصير الأجل. الخطر الرئيسي هو ضعف قوة الاتجاه؛ إذ يبلغ ADX مستوى 10.4، ما يعني أن أياً من الطرفين لا يملك سيطرة واضحة. مستوى إبطال الإعداد هو 2666.50.
عند أي مستوى ستجني الأرباح من ETH إذا تحقق هذا الإعداد؟
المستويات محددة على الرسم البياني أدناه.
{future}(ETHUSDT)
📲 هل تريد المزيد من أحدث إشاراتي؟ انضم إليّ هنا:
[https://app.binance.com/uni-qr/D26WbL9t](https://app.binance.com/uni-qr/D26WbL9t)
⚠️ تحليل شخصي للسوق فقط. ليس نصيحة مالية — أدر المخاطر وقم بأبحاثك الخاصة.
محتوى تعليمي، وليس نصيحة استثمارية أو توصية بشراء أي أصل أو بيعه أو إيداعه أو سحبه. لا توجد ترويجات مدفوعة أو روابط إحالة/تسويق بالعمولة.
إيثيريوم ليس هبوطياً بالقدر الذي تدّعيه العناوين
🟢 شراء طويل $ETH /USDT: توقّع ارتفاع السعر
التوجّه: شراء طويل · ميل صعودي
الدخول: 2709.04 – 2713.02
الهدف 1: 2744.43 (+1.2%)
الهدف 2: 2766.69 (+2.1%)
الهدف 3: 2800.09 (+3.3%)
وقف الخسارة: 2666.50 (-1.6%)
الخطة: ادخل فقط ضمن النطاق، وبِع نصف الكمية عند الهدف 1، ثم حرّك وقف الخسارة إلى سعر الدخول.
ملاحظة: الثقة متوسطة فحسب، لذا أبقِ حجم الصفقة صغيراً.
لماذا الشراء الطويل؟ التوجّه يميل إلى الشراء الطويل؛ 4 من أصل 12 إشارة تؤيده، ولا تعارضه أي إشارة، فيما لم تحسم 8 إشارات موقفها.
• الاتجاه اليومي: السعر > EMA50 > EMA200، ترتيب صعودي → الاتجاه العام صاعد
• اتجاه 4 ساعات: السعر > EMA50 > EMA200، ترتيب صعودي → اتجاه التأرجح صاعد
• اتجاه ساعة واحدة: السعر > EMA50 > EMA200، ترتيب صعودي → الاتجاه قصير الأجل صاعد
ملاحظة في سجل التداول: ETH
أراقب ETH لأن الاتجاه اليومي واتجاه 4 ساعات صعوديان. أريد أن أرى السعر يصمد فوق EMA50 على إطار الساعة، مع إظهار RSI على إطار الساعة أن الزخم في صالح المشترين. يميل الإعداد إلى الشراء الطويل، ودرجة الثقة متوسطة. الاتجاه اليومي صعودي، وRSI على إطار الساعة عند 58.9، ما يعني أن المشترين يسيطرون على الزخم قصير الأجل. الخطر الرئيسي هو ضعف قوة الاتجاه؛ إذ يبلغ ADX مستوى 10.4، ما يعني أن أياً من الطرفين لا يملك سيطرة واضحة. مستوى إبطال الإعداد هو 2666.50.
عند أي مستوى ستجني الأرباح من ETH إذا تحقق هذا الإعداد؟
المستويات محددة على الرسم البياني أدناه.
📲 هل تريد المزيد من أحدث إشاراتي؟ انضم إليّ هنا:
https://app.binance.com/uni-qr/D26WbL9t
⚠️ تحليل شخصي للسوق فقط. ليس نصيحة مالية — أدر المخاطر وقم بأبحاثك الخاصة.
محتوى تعليمي، وليس نصيحة استثمارية أو توصية بشراء أي أصل أو بيعه أو إيداعه أو سحبه. لا توجد ترويجات مدفوعة أو روابط إحالة/تسويق بالعمولة.
🟢 شراء طويل $ETH /USDT: توقّع ارتفاع السعر
التوجّه: شراء طويل · ميل صعودي
الدخول: 2709.04 – 2713.02
الهدف 1: 2744.43 (+1.2%)
الهدف 2: 2766.69 (+2.1%)
الهدف 3: 2800.09 (+3.3%)
وقف الخسارة: 2666.50 (-1.6%)
الخطة: ادخل فقط ضمن النطاق، وبِع نصف الكمية عند الهدف 1، ثم حرّك وقف الخسارة إلى سعر الدخول.
ملاحظة: الثقة متوسطة فحسب، لذا أبقِ حجم الصفقة صغيراً.
لماذا الشراء الطويل؟ التوجّه يميل إلى الشراء الطويل؛ 4 من أصل 12 إشارة تؤيده، ولا تعارضه أي إشارة، فيما لم تحسم 8 إشارات موقفها.
• الاتجاه اليومي: السعر > EMA50 > EMA200، ترتيب صعودي → الاتجاه العام صاعد
• اتجاه 4 ساعات: السعر > EMA50 > EMA200، ترتيب صعودي → اتجاه التأرجح صاعد
• اتجاه ساعة واحدة: السعر > EMA50 > EMA200، ترتيب صعودي → الاتجاه قصير الأجل صاعد
ملاحظة في سجل التداول: ETH
أراقب ETH لأن الاتجاه اليومي واتجاه 4 ساعات صعوديان. أريد أن أرى السعر يصمد فوق EMA50 على إطار الساعة، مع إظهار RSI على إطار الساعة أن الزخم في صالح المشترين. يميل الإعداد إلى الشراء الطويل، ودرجة الثقة متوسطة. الاتجاه اليومي صعودي، وRSI على إطار الساعة عند 58.9، ما يعني أن المشترين يسيطرون على الزخم قصير الأجل. الخطر الرئيسي هو ضعف قوة الاتجاه؛ إذ يبلغ ADX مستوى 10.4، ما يعني أن أياً من الطرفين لا يملك سيطرة واضحة. مستوى إبطال الإعداد هو 2666.50.
عند أي مستوى ستجني الأرباح من ETH إذا تحقق هذا الإعداد؟
المستويات محددة على الرسم البياني أدناه.
📲 هل تريد المزيد من أحدث إشاراتي؟ انضم إليّ هنا:
https://app.binance.com/uni-qr/D26WbL9t
⚠️ تحليل شخصي للسوق فقط. ليس نصيحة مالية — أدر المخاطر وقم بأبحاثك الخاصة.
محتوى تعليمي، وليس نصيحة استثمارية أو توصية بشراء أي أصل أو بيعه أو إيداعه أو سحبه. لا توجد ترويجات مدفوعة أو روابط إحالة/تسويق بالعمولة.
2
427
·
--
صاعد
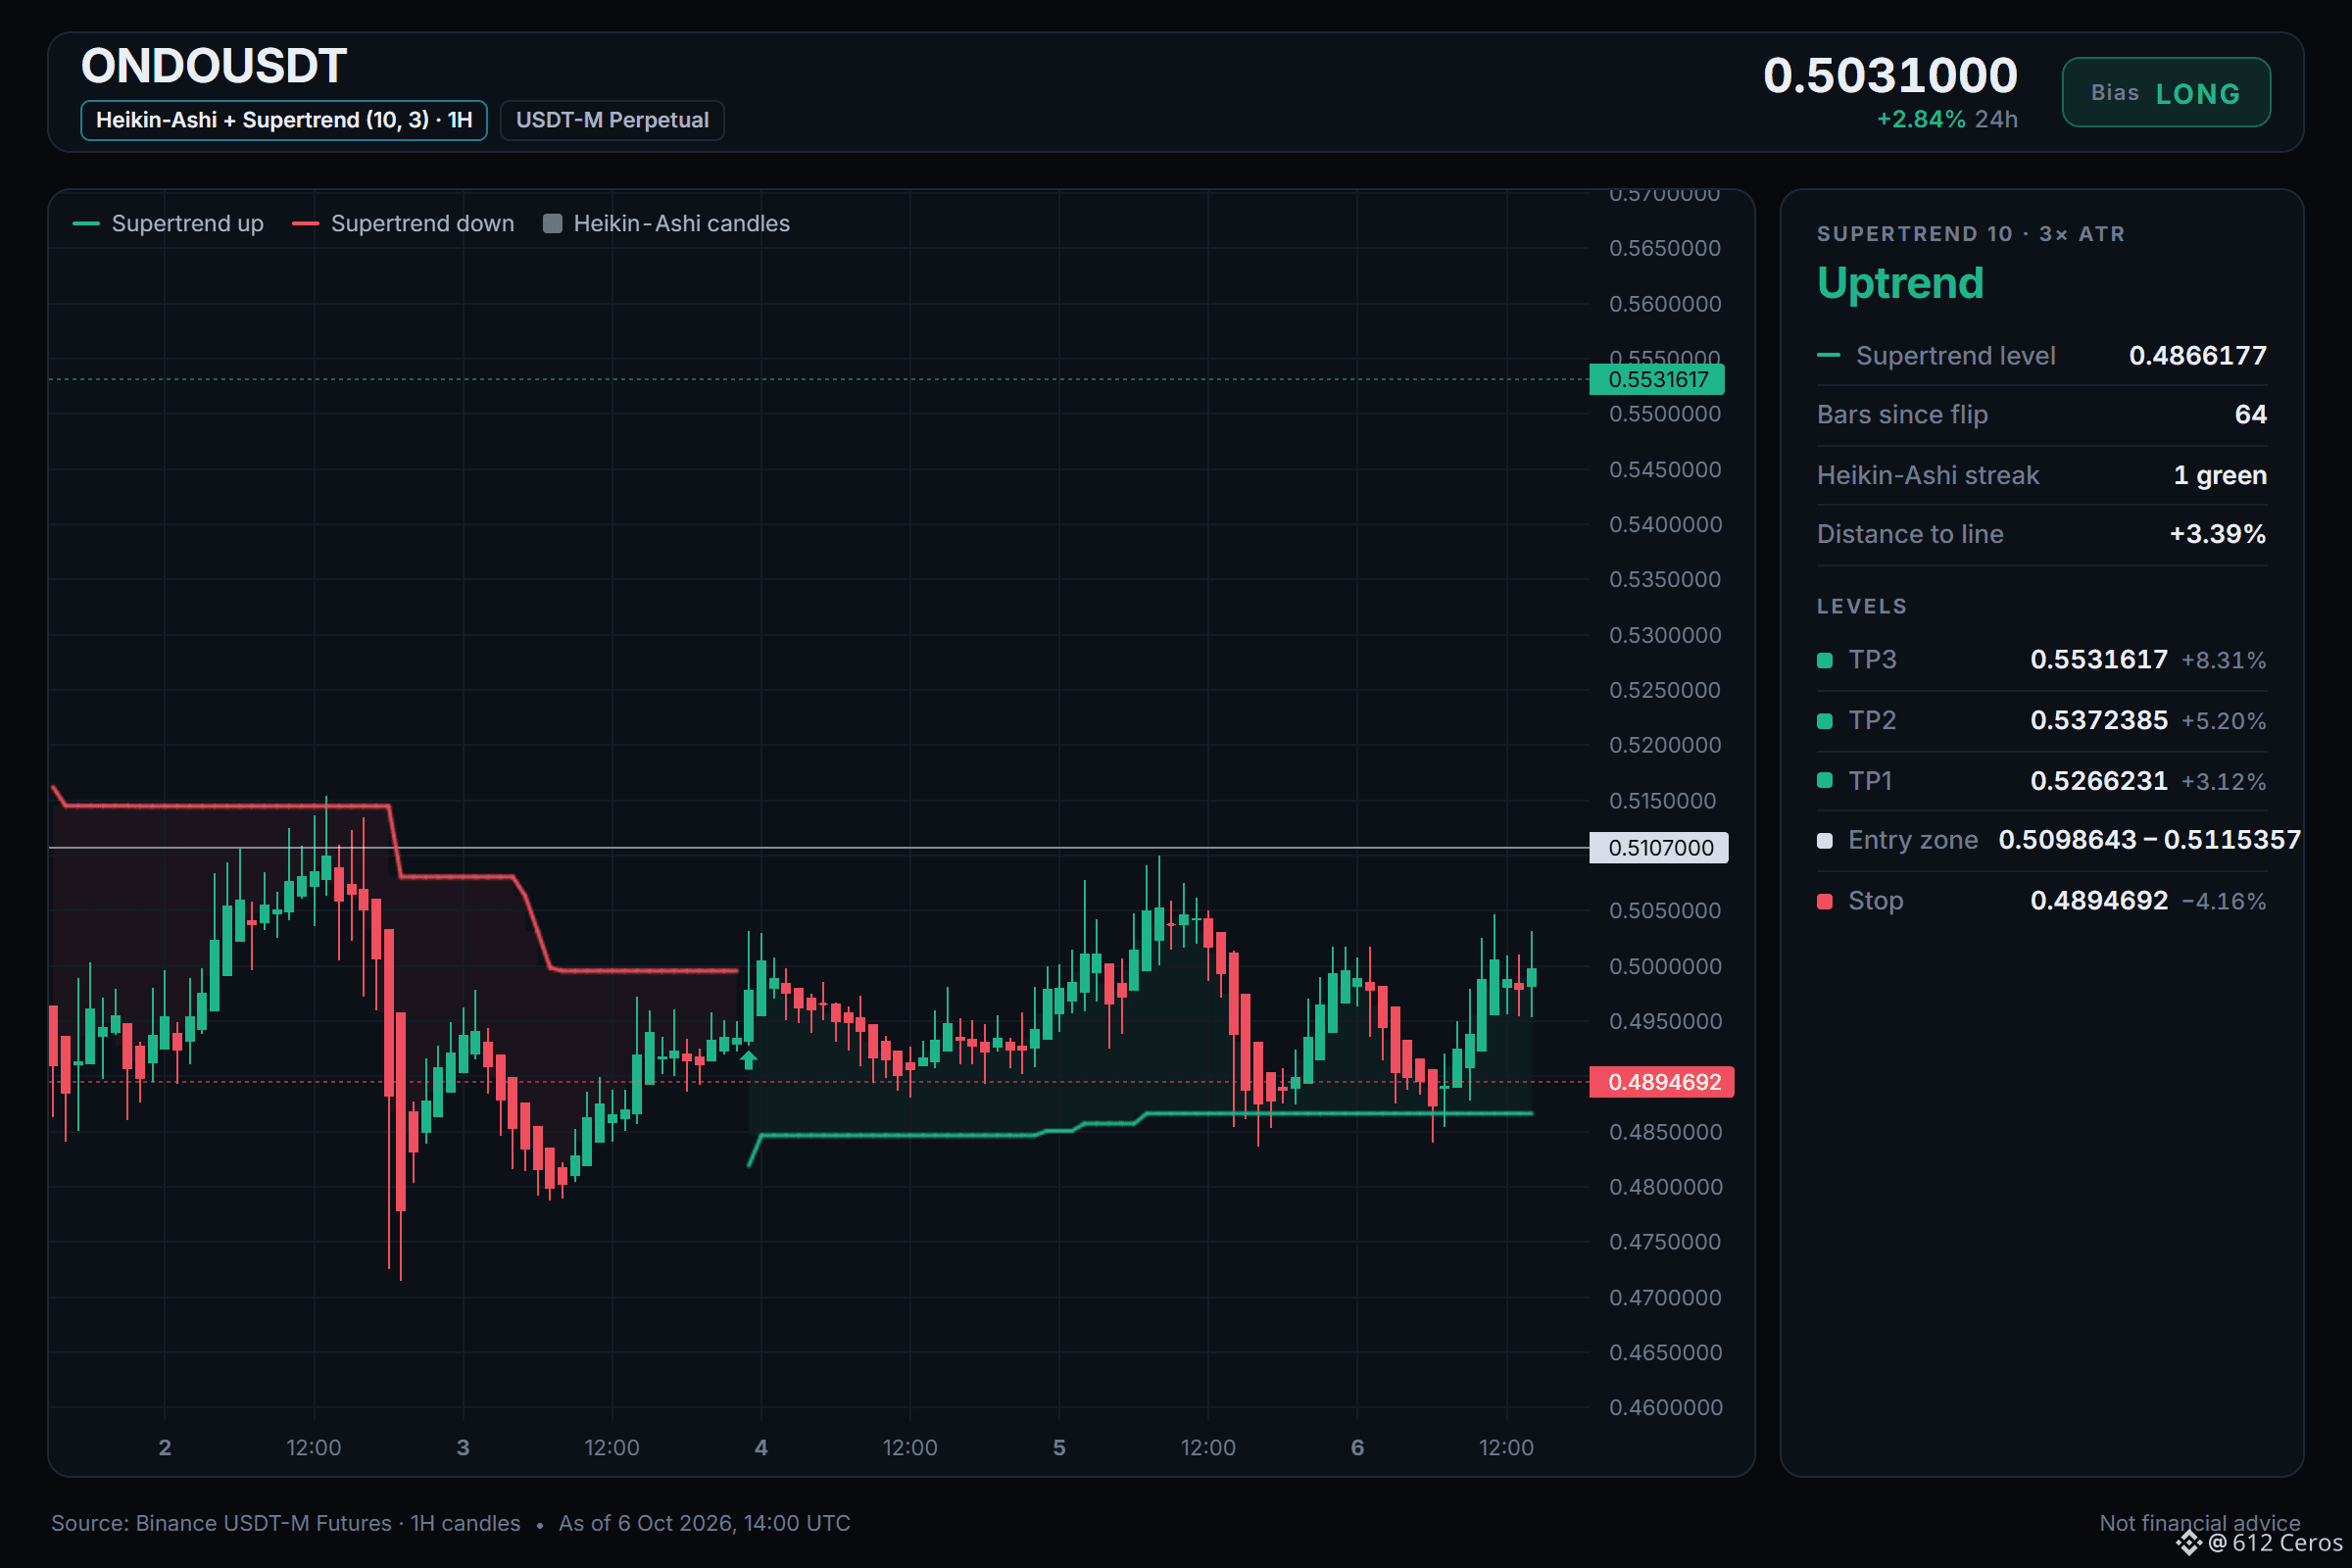
يحافظ ONDO على ترتيب صعودي عبر الإطارين اليومي و4 ساعات
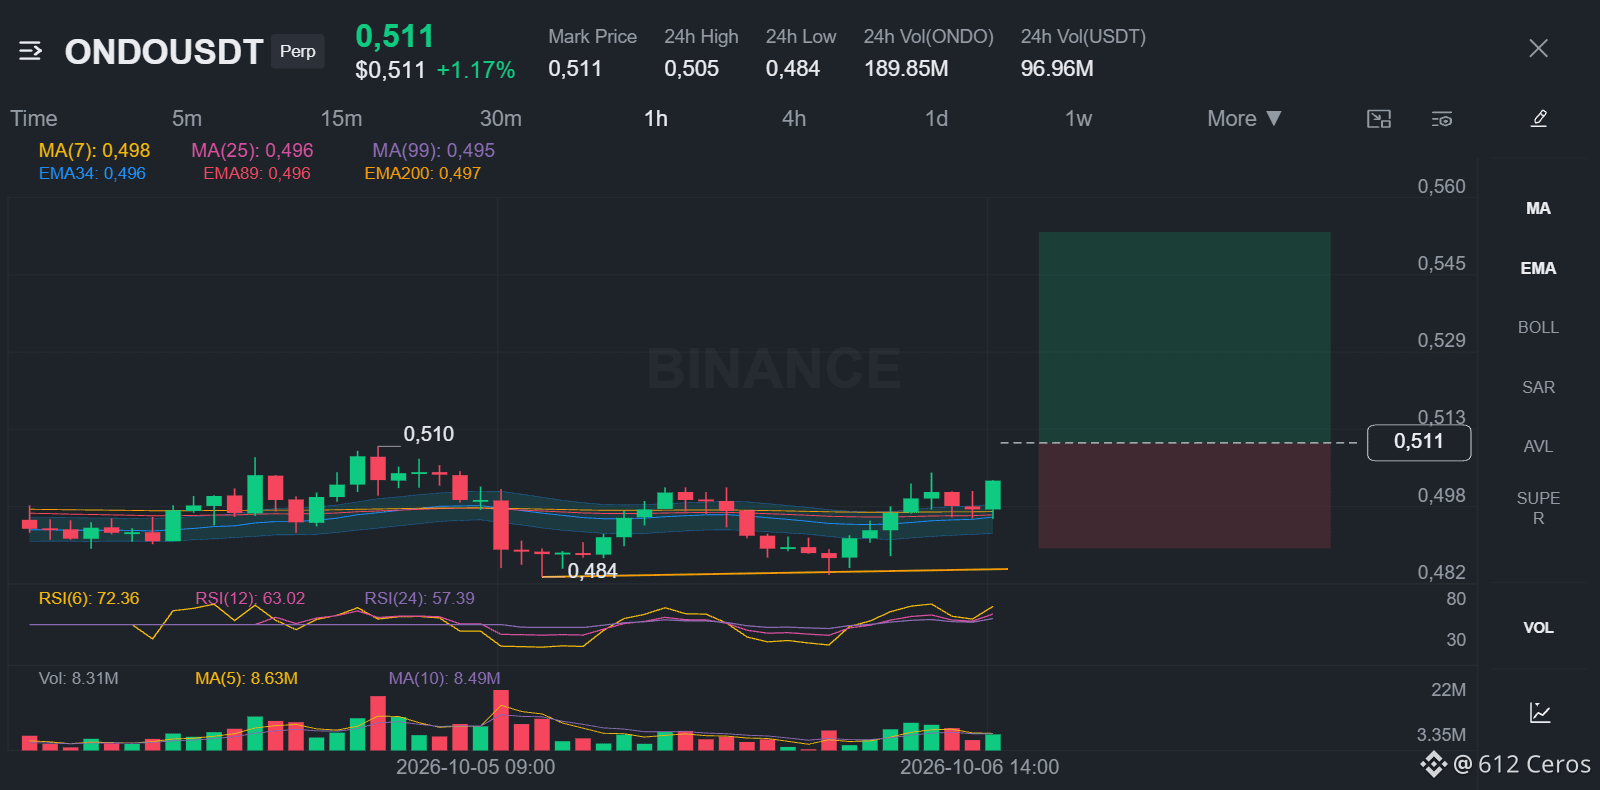
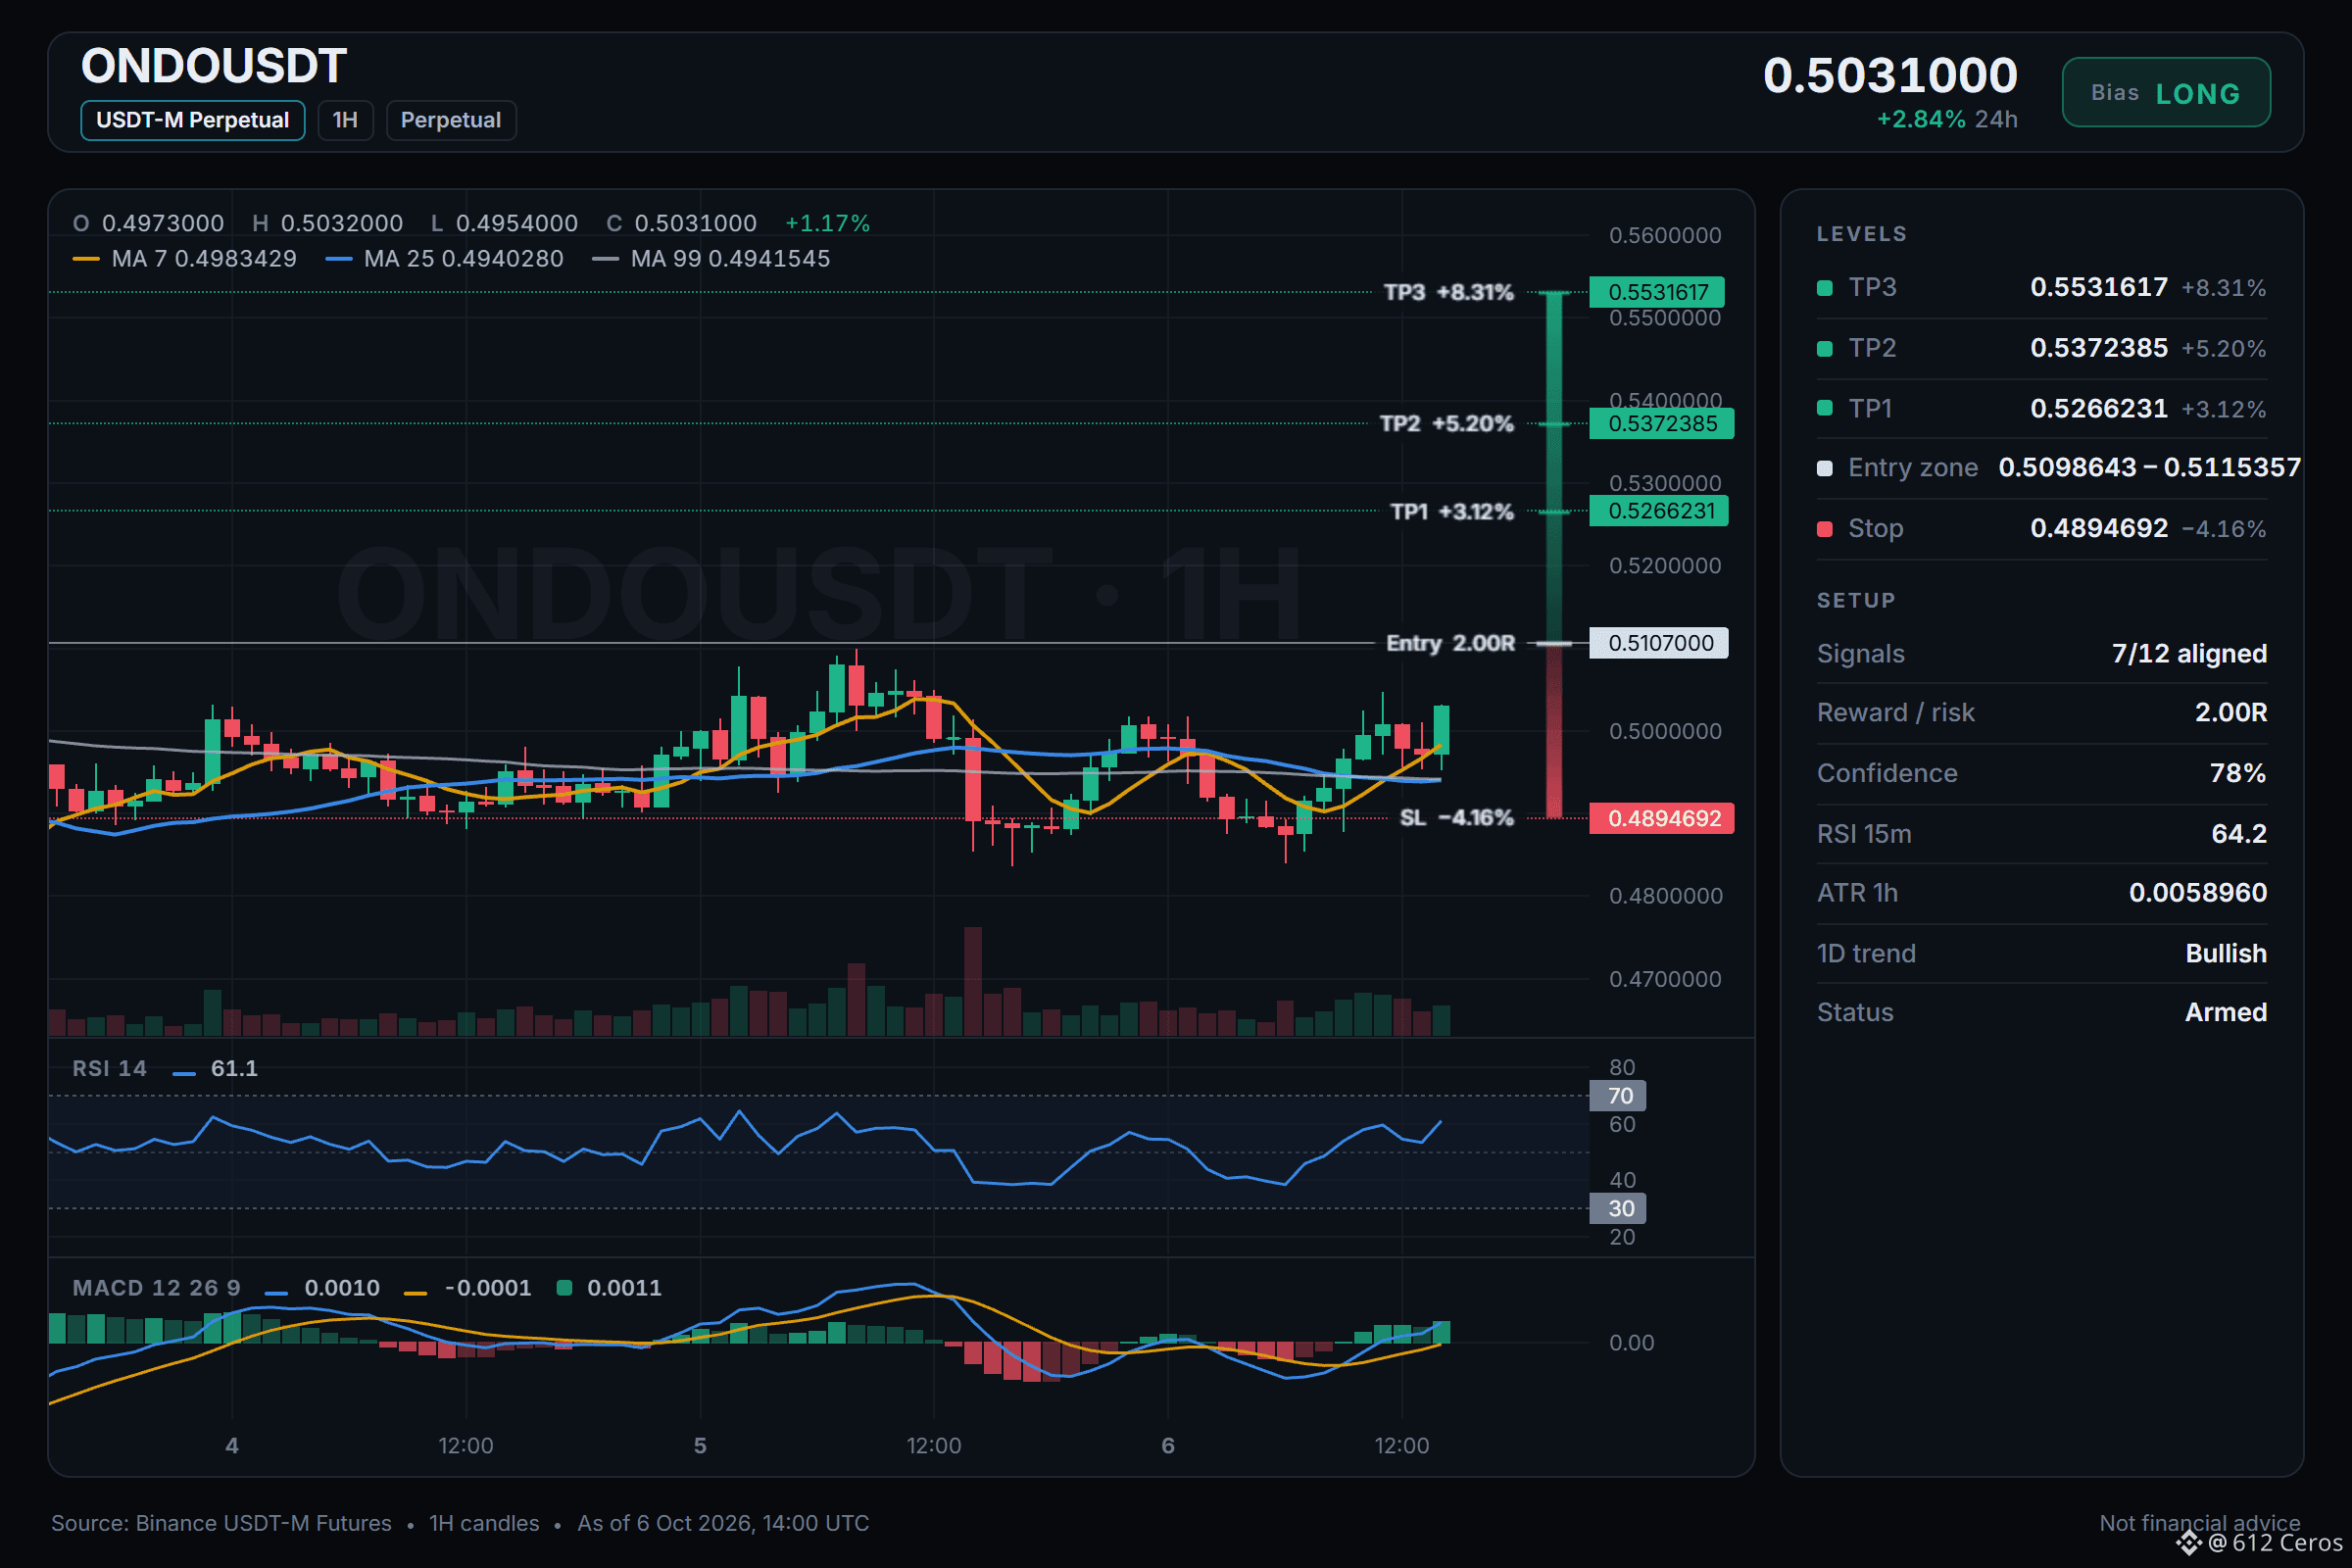
🟢 شراء طويل $ONDO /USDT: من المتوقع أن يرتفع السعر
التوجه: شراء طويل · قوي
الدخول: 0.5098643 – 0.5115357
الهدف 1: 0.5266231 (+3.1%)
الهدف 2: 0.5372385 (+5.2%)
الهدف 3: 0.5531617 (+8.3%)
وقف الخسارة: 0.4894692 (-4.2%)
الخطة: ادخل فقط ضمن النطاق، وخذ نصف الكمية عند الهدف 1، ثم انقل وقف الخسارة إلى سعر الدخول.
لماذا الشراء؟ ما الذي تحققت منه: 7/12 من الإشارات متوافقة، و0 تعارض، و5 غير حاسمة
• الاتجاه اليومي: السعر > EMA50 > EMA200، ترتيب صعودي → الاتجاه العام صاعد
• اتجاه 4 ساعات: السعر > EMA50 > EMA200، ترتيب صعودي → اتجاه التأرجح صاعد
• قوة الاتجاه (ADX/DI، 15 دقيقة): ADX عند 24.0 مع سيطرة المشترين (DI+ 32.5 مقابل DI− 11.0) → المشترون يقودون الحركة
تنبيه: تصبح الفكرة غير صالحة إذا وصل السعر إلى وقف الخسارة عند 0.4894692
الخلاصة: الاتجاه اليومي ذو ترتيب صعودي، والسعر أعلى من EMA50 وEMA200، وهو العامل الأقوى، بينما اتجاه الساعة مختلط، ما يعني أن الاتجاه قصير الأجل لم يتضح بعد.
أين ستضع وقف الخسارة لهذه الصفقة؟
الرسم البياني أدناه يتضمن جميع المستويات.
{future}(ONDOUSDT)
📲 أتريد المزيد من أحدث إشاراتي؟ انضم إليّ هنا:
[https://app.binance.com/uni-qr/D26WbL9t](https://app.binance.com/uni-qr/D26WbL9t)
⚠️ تحليل شخصي للسوق فقط. NFA — أدر المخاطر بنفسك وأجرِ بحثك الخاص.
محتوى تعليمي، وليس نصيحة استثمارية أو توصية بشراء أي أصل أو بيعه أو إيداعه أو سحبه. لا توجد ترويجات مدفوعة أو روابط إحالة/شراكة.
يحافظ ONDO على ترتيب صعودي عبر الإطارين اليومي و4 ساعات
🟢 شراء طويل $ONDO /USDT: من المتوقع أن يرتفع السعر
التوجه: شراء طويل · قوي
الدخول: 0.5098643 – 0.5115357
الهدف 1: 0.5266231 (+3.1%)
الهدف 2: 0.5372385 (+5.2%)
الهدف 3: 0.5531617 (+8.3%)
وقف الخسارة: 0.4894692 (-4.2%)
الخطة: ادخل فقط ضمن النطاق، وخذ نصف الكمية عند الهدف 1، ثم انقل وقف الخسارة إلى سعر الدخول.
لماذا الشراء؟ ما الذي تحققت منه: 7/12 من الإشارات متوافقة، و0 تعارض، و5 غير حاسمة
• الاتجاه اليومي: السعر > EMA50 > EMA200، ترتيب صعودي → الاتجاه العام صاعد
• اتجاه 4 ساعات: السعر > EMA50 > EMA200، ترتيب صعودي → اتجاه التأرجح صاعد
• قوة الاتجاه (ADX/DI، 15 دقيقة): ADX عند 24.0 مع سيطرة المشترين (DI+ 32.5 مقابل DI− 11.0) → المشترون يقودون الحركة
تنبيه: تصبح الفكرة غير صالحة إذا وصل السعر إلى وقف الخسارة عند 0.4894692
الخلاصة: الاتجاه اليومي ذو ترتيب صعودي، والسعر أعلى من EMA50 وEMA200، وهو العامل الأقوى، بينما اتجاه الساعة مختلط، ما يعني أن الاتجاه قصير الأجل لم يتضح بعد.
أين ستضع وقف الخسارة لهذه الصفقة؟
الرسم البياني أدناه يتضمن جميع المستويات.
📲 أتريد المزيد من أحدث إشاراتي؟ انضم إليّ هنا:
https://app.binance.com/uni-qr/D26WbL9t
⚠️ تحليل شخصي للسوق فقط. NFA — أدر المخاطر بنفسك وأجرِ بحثك الخاص.
محتوى تعليمي، وليس نصيحة استثمارية أو توصية بشراء أي أصل أو بيعه أو إيداعه أو سحبه. لا توجد ترويجات مدفوعة أو روابط إحالة/شراكة.
🟢 شراء طويل $ONDO /USDT: من المتوقع أن يرتفع السعر
التوجه: شراء طويل · قوي
الدخول: 0.5098643 – 0.5115357
الهدف 1: 0.5266231 (+3.1%)
الهدف 2: 0.5372385 (+5.2%)
الهدف 3: 0.5531617 (+8.3%)
وقف الخسارة: 0.4894692 (-4.2%)
الخطة: ادخل فقط ضمن النطاق، وخذ نصف الكمية عند الهدف 1، ثم انقل وقف الخسارة إلى سعر الدخول.
لماذا الشراء؟ ما الذي تحققت منه: 7/12 من الإشارات متوافقة، و0 تعارض، و5 غير حاسمة
• الاتجاه اليومي: السعر > EMA50 > EMA200، ترتيب صعودي → الاتجاه العام صاعد
• اتجاه 4 ساعات: السعر > EMA50 > EMA200، ترتيب صعودي → اتجاه التأرجح صاعد
• قوة الاتجاه (ADX/DI، 15 دقيقة): ADX عند 24.0 مع سيطرة المشترين (DI+ 32.5 مقابل DI− 11.0) → المشترون يقودون الحركة
تنبيه: تصبح الفكرة غير صالحة إذا وصل السعر إلى وقف الخسارة عند 0.4894692
الخلاصة: الاتجاه اليومي ذو ترتيب صعودي، والسعر أعلى من EMA50 وEMA200، وهو العامل الأقوى، بينما اتجاه الساعة مختلط، ما يعني أن الاتجاه قصير الأجل لم يتضح بعد.
أين ستضع وقف الخسارة لهذه الصفقة؟
الرسم البياني أدناه يتضمن جميع المستويات.
📲 أتريد المزيد من أحدث إشاراتي؟ انضم إليّ هنا:
https://app.binance.com/uni-qr/D26WbL9t
⚠️ تحليل شخصي للسوق فقط. NFA — أدر المخاطر بنفسك وأجرِ بحثك الخاص.
محتوى تعليمي، وليس نصيحة استثمارية أو توصية بشراء أي أصل أو بيعه أو إيداعه أو سحبه. لا توجد ترويجات مدفوعة أو روابط إحالة/شراكة.
1
360
·
--
هابط
الاتجاه اليومي هابط، والبائعون يسيطرون
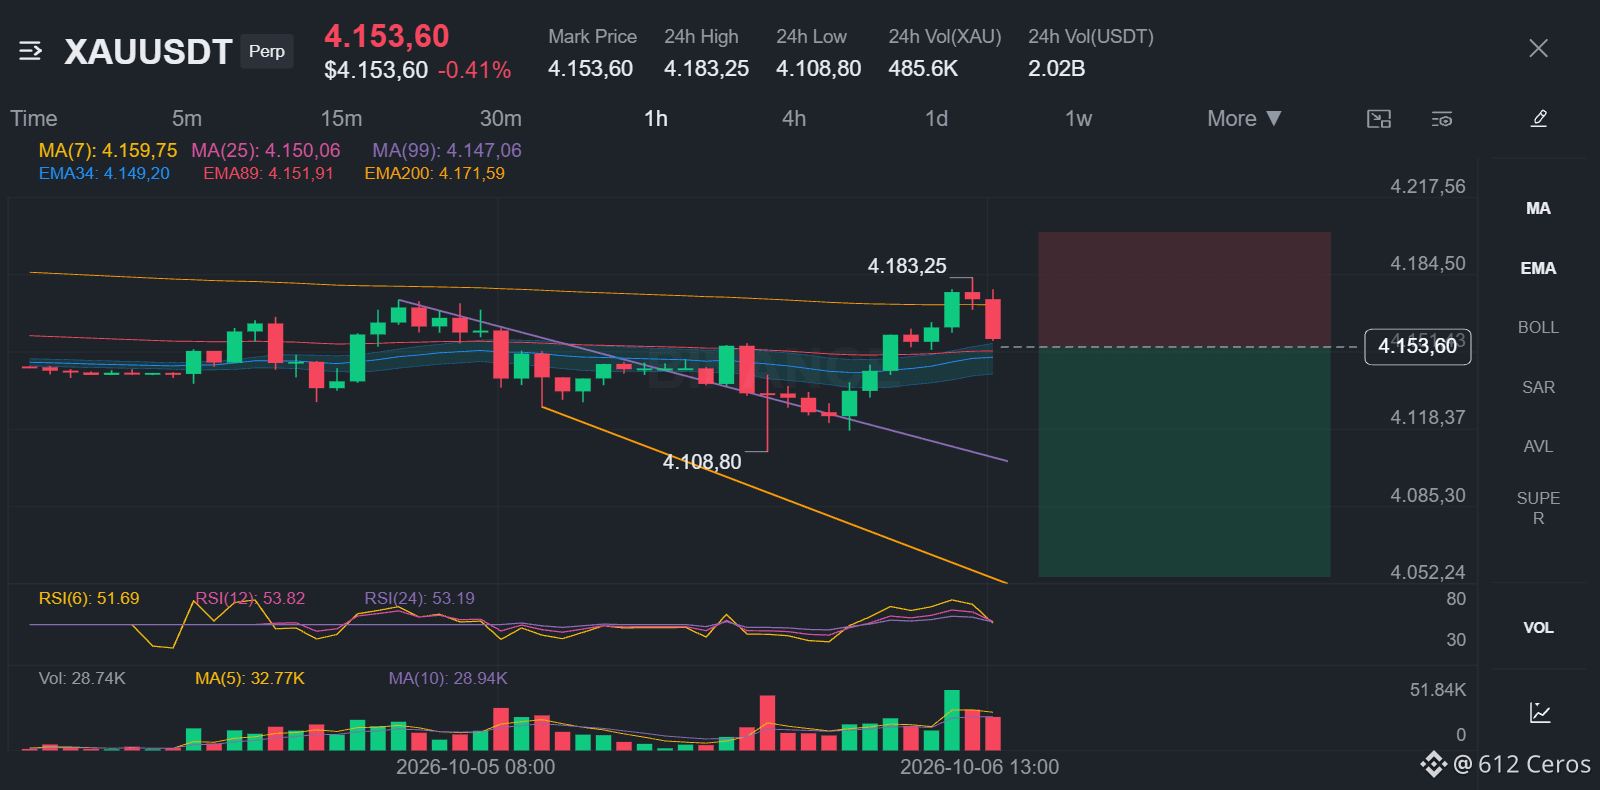
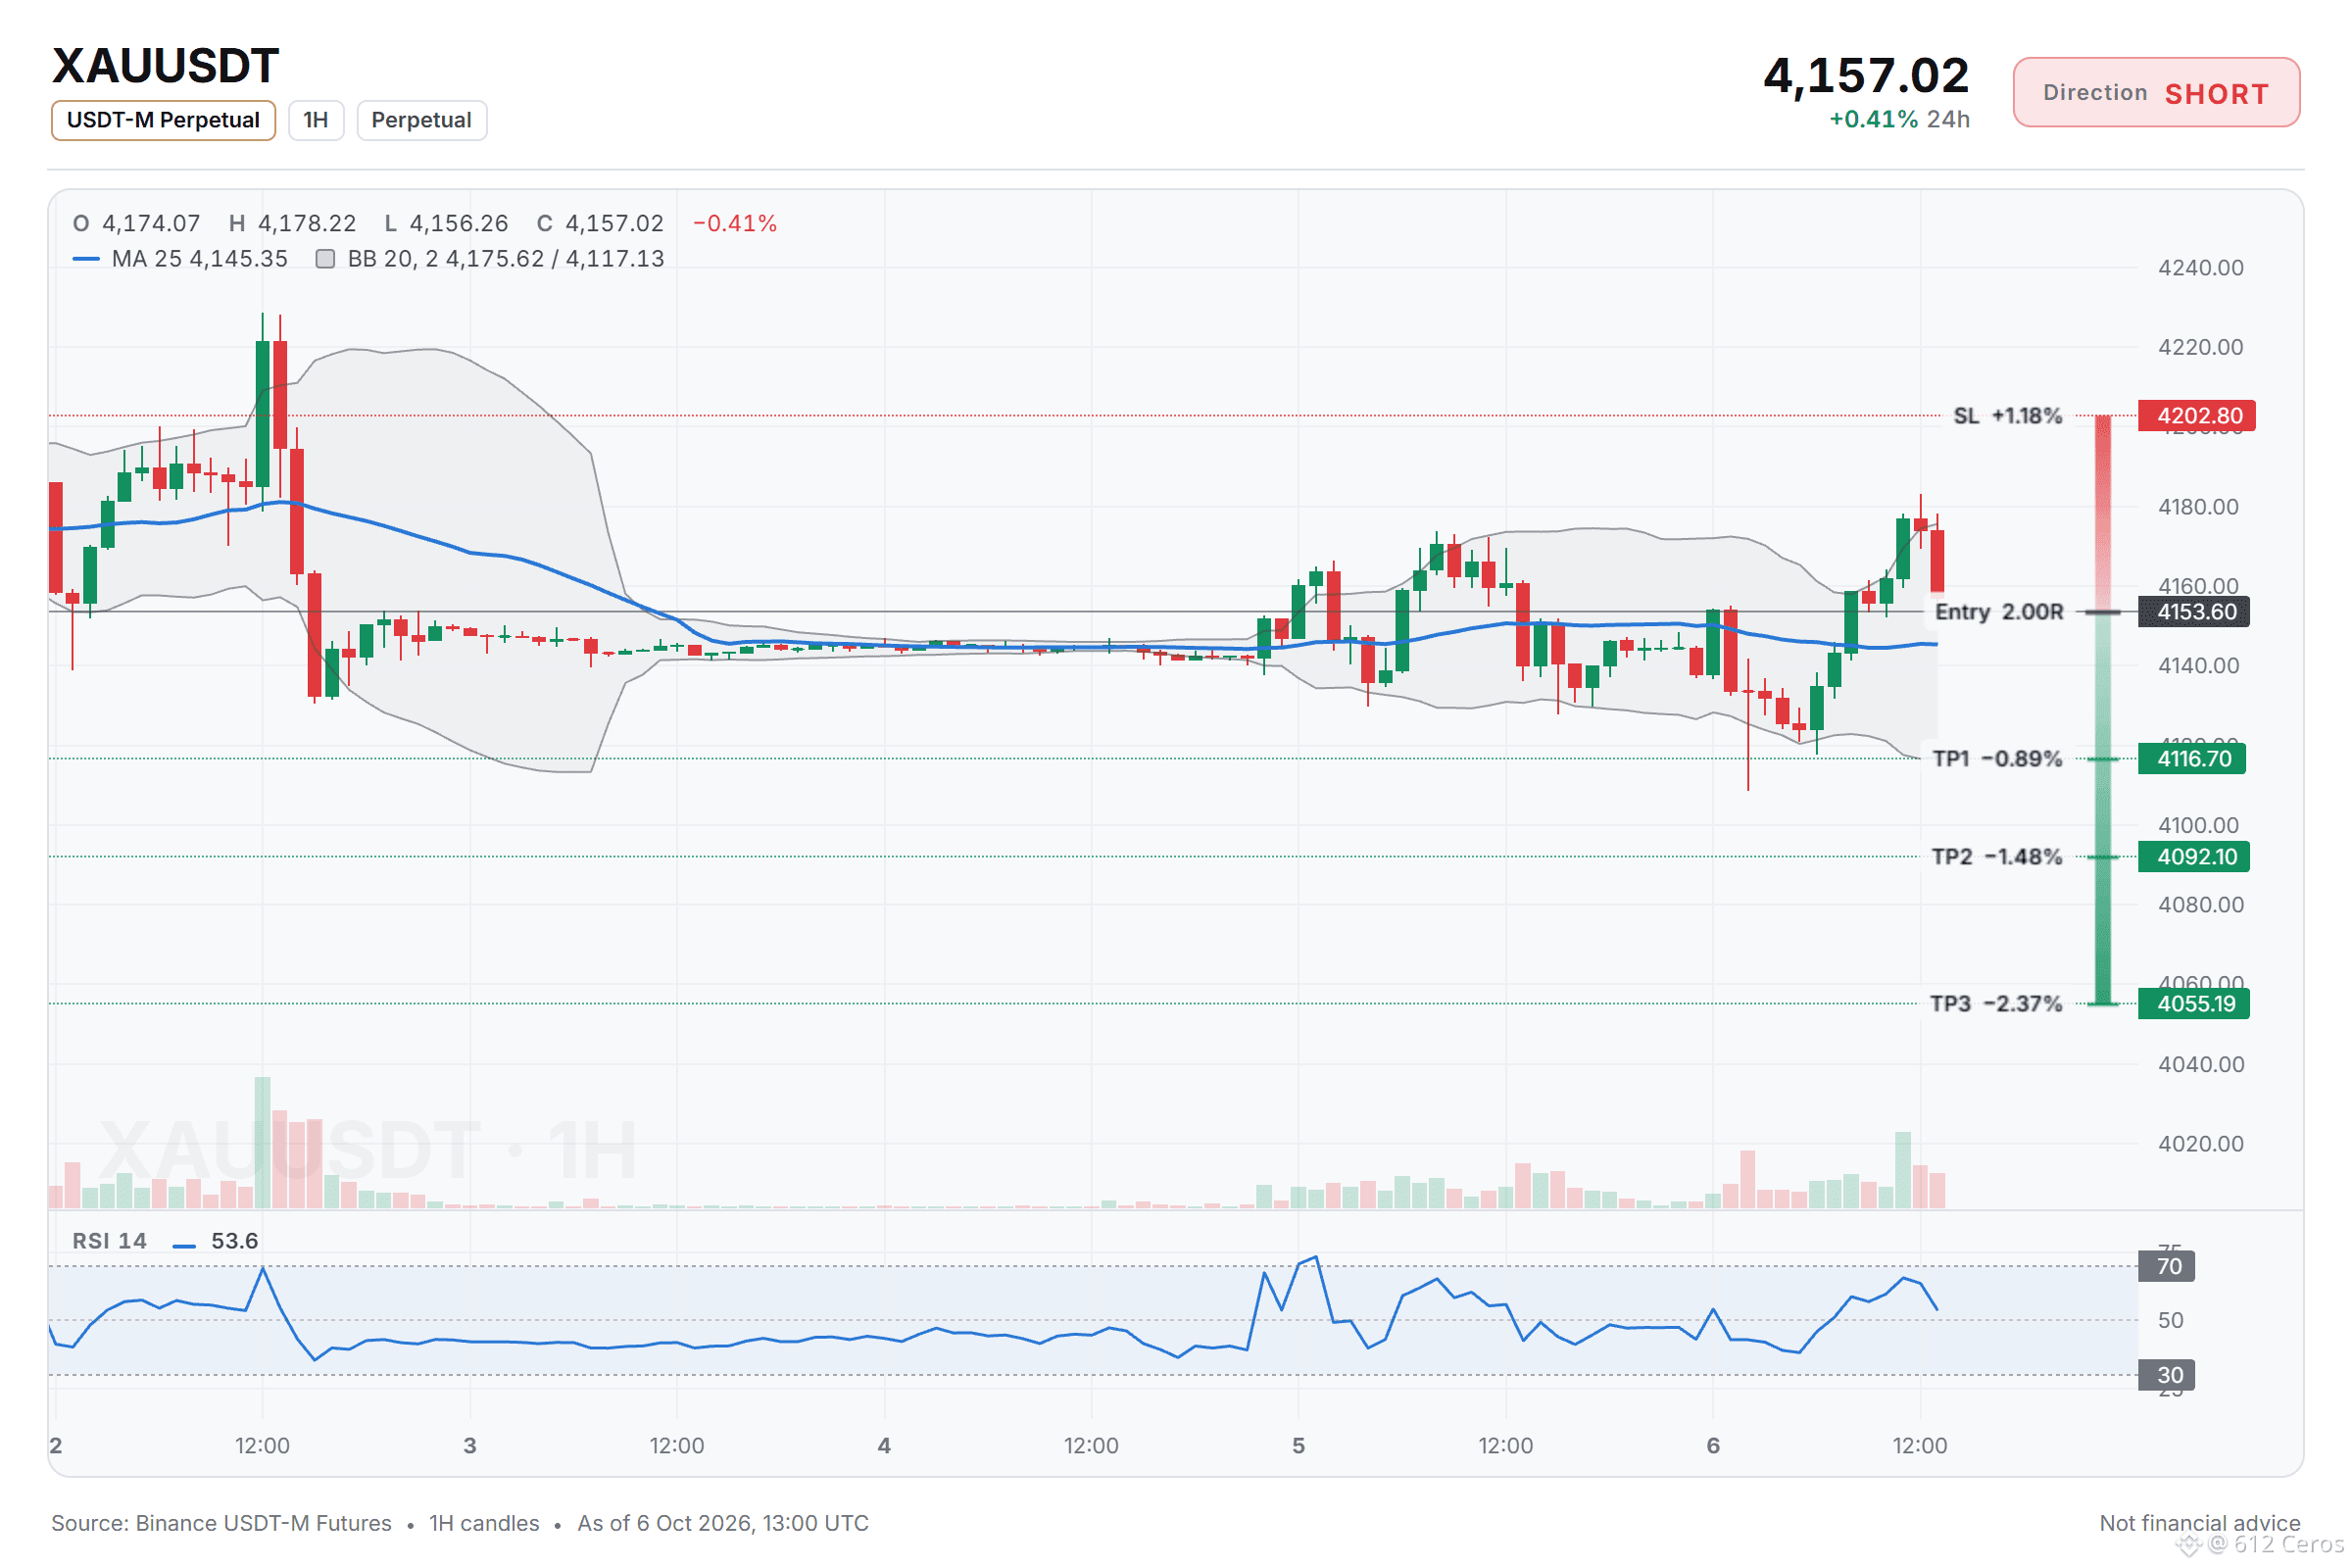
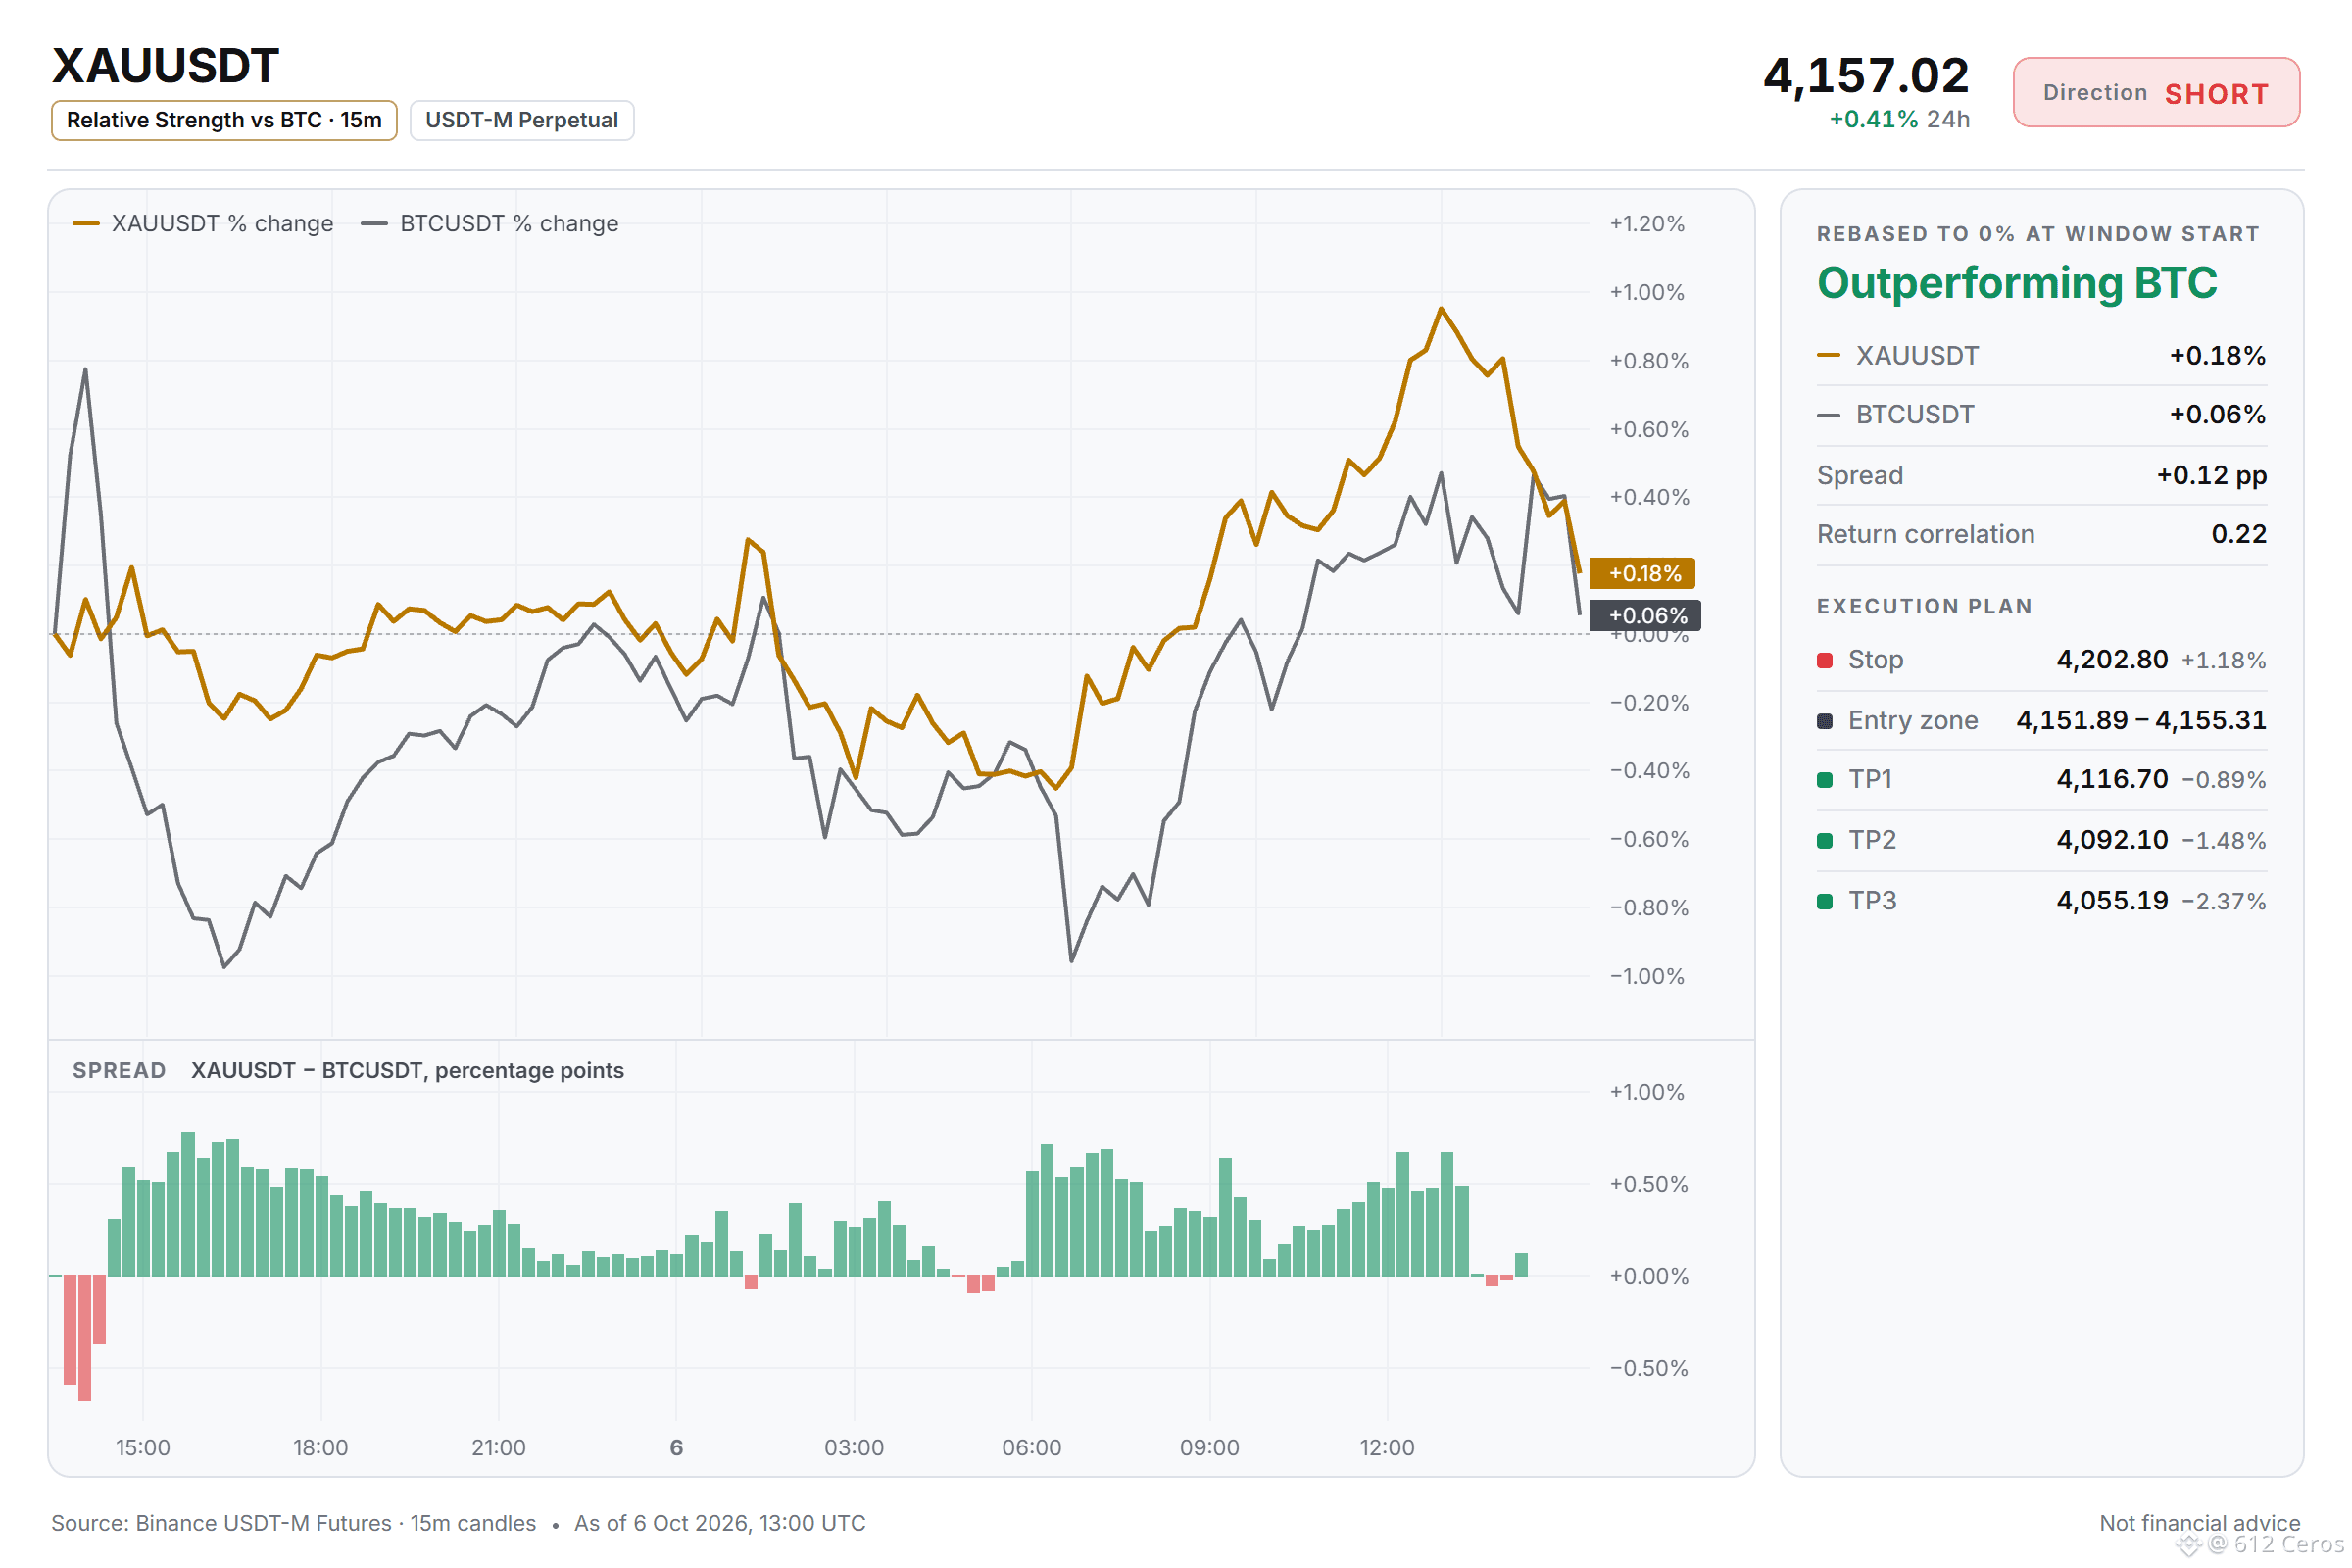
🔴 بيع على المكشوف $XAU /USDT: نتوقع هبوط السعر
الانحياز: بيع على المكشوف · ميل
الدخول: 4151.89 – 4155.31
جني الأرباح 1: 4116.70 (-0.9%)
جني الأرباح 2: 4092.10 (-1.5%)
جني الأرباح 3: 4055.19 (-2.4%)
وقف الخسارة: 4202.80 (+1.2%)
الخطة: ادخل فقط ضمن النطاق، وخذ نصف الكمية عند جني الأرباح 1، ثم انقل وقف الخسارة إلى سعر الدخول.
ملاحظة: القناعة متوسطة فقط، لذا أبقِ حجم الصفقة صغيرًا.
لماذا البيع على المكشوف؟ التوصية تميل إلى البيع، إذ تتفق 3 من أصل 12 إشارة، وتعارضها إشارة واحدة، بينما 8 إشارات غير حاسمة.
• الاتجاه اليومي: السعر < EMA50 < EMA200، ترتيب هابط → الاتجاه العام هابط
• اتجاه 4 ساعات: السعر < EMA50 < EMA200، ترتيب هابط → اتجاه التأرجح هابط
• قوة الاتجاه (ADX/DI، إطار 15 دقيقة): ADX عند 29.0 والبائعون مسيطرون (DI+ 17.7 مقابل DI− 31.1) → البائعون يدفعون الحركة
المخاطر: مؤشر RSI لإطار 4 ساعات عند 59.3، والزخم صعودي (أعلى من 55) → المشترون يملكون الزخم
باختصار:
1/4 الاتجاه اليومي هابط، والسعر أدنى من EMA50 وEMA200، ما يعني أن الصورة العامة هابطة.
2/4 اتجاه 4 ساعات هابط أيضًا، والسعر أدنى من EMA50 وEMA200، ما يعني أن اتجاه التأرجح هابط.
3/4 قيمة ADX البالغة 29.0، مع DI السالب عند 31.1 مقابل DI الموجب عند 17.7، تعني أن البائعين يدفعون الحركة.
4/4 مؤشر RSI لإطار 4 ساعات عند 59.3، ما يشير إلى زخم صعودي أعلى من 55، لذا فالمشترون يملكون الزخم.
إذا كنت في صفقة شراء أو تخطط لتغيير اتجاهك، فما المستوى الذي ستعتمده للدفاع عن انحيازك؟
الإعداد الكامل موضح في الرسم البياني أدناه.
{future}(XAUUSDT)
📲 هل تريد المزيد من أحدث إشاراتي؟ انضم إليّ هنا:
[https://app.binance.com/uni-qr/D26WbL9t](https://app.binance.com/uni-qr/D26WbL9t)
⚠️ تحليل شخصي للسوق فقط. لا يُعد نصيحة مالية — أدر المخاطر وأجرِ بحثك الخاص.
محتوى تعليمي، وليس نصيحة استثمارية أو توصية بشراء أي أصل أو بيعه أو إيداعه أو سحبه. لا توجد إعلانات مدفوعة أو روابط إحالة/شراكة.
الاتجاه اليومي هابط، والبائعون يسيطرون
🔴 بيع على المكشوف $XAU /USDT: نتوقع هبوط السعر
الانحياز: بيع على المكشوف · ميل
الدخول: 4151.89 – 4155.31
جني الأرباح 1: 4116.70 (-0.9%)
جني الأرباح 2: 4092.10 (-1.5%)
جني الأرباح 3: 4055.19 (-2.4%)
وقف الخسارة: 4202.80 (+1.2%)
الخطة: ادخل فقط ضمن النطاق، وخذ نصف الكمية عند جني الأرباح 1، ثم انقل وقف الخسارة إلى سعر الدخول.
ملاحظة: القناعة متوسطة فقط، لذا أبقِ حجم الصفقة صغيرًا.
لماذا البيع على المكشوف؟ التوصية تميل إلى البيع، إذ تتفق 3 من أصل 12 إشارة، وتعارضها إشارة واحدة، بينما 8 إشارات غير حاسمة.
• الاتجاه اليومي: السعر < EMA50 < EMA200، ترتيب هابط → الاتجاه العام هابط
• اتجاه 4 ساعات: السعر < EMA50 < EMA200، ترتيب هابط → اتجاه التأرجح هابط
• قوة الاتجاه (ADX/DI، إطار 15 دقيقة): ADX عند 29.0 والبائعون مسيطرون (DI+ 17.7 مقابل DI− 31.1) → البائعون يدفعون الحركة
المخاطر: مؤشر RSI لإطار 4 ساعات عند 59.3، والزخم صعودي (أعلى من 55) → المشترون يملكون الزخم
باختصار:
1/4 الاتجاه اليومي هابط، والسعر أدنى من EMA50 وEMA200، ما يعني أن الصورة العامة هابطة.
2/4 اتجاه 4 ساعات هابط أيضًا، والسعر أدنى من EMA50 وEMA200، ما يعني أن اتجاه التأرجح هابط.
3/4 قيمة ADX البالغة 29.0، مع DI السالب عند 31.1 مقابل DI الموجب عند 17.7، تعني أن البائعين يدفعون الحركة.
4/4 مؤشر RSI لإطار 4 ساعات عند 59.3، ما يشير إلى زخم صعودي أعلى من 55، لذا فالمشترون يملكون الزخم.
إذا كنت في صفقة شراء أو تخطط لتغيير اتجاهك، فما المستوى الذي ستعتمده للدفاع عن انحيازك؟
الإعداد الكامل موضح في الرسم البياني أدناه.
📲 هل تريد المزيد من أحدث إشاراتي؟ انضم إليّ هنا:
https://app.binance.com/uni-qr/D26WbL9t
⚠️ تحليل شخصي للسوق فقط. لا يُعد نصيحة مالية — أدر المخاطر وأجرِ بحثك الخاص.
محتوى تعليمي، وليس نصيحة استثمارية أو توصية بشراء أي أصل أو بيعه أو إيداعه أو سحبه. لا توجد إعلانات مدفوعة أو روابط إحالة/شراكة.
🔴 بيع على المكشوف $XAU /USDT: نتوقع هبوط السعر
الانحياز: بيع على المكشوف · ميل
الدخول: 4151.89 – 4155.31
جني الأرباح 1: 4116.70 (-0.9%)
جني الأرباح 2: 4092.10 (-1.5%)
جني الأرباح 3: 4055.19 (-2.4%)
وقف الخسارة: 4202.80 (+1.2%)
الخطة: ادخل فقط ضمن النطاق، وخذ نصف الكمية عند جني الأرباح 1، ثم انقل وقف الخسارة إلى سعر الدخول.
ملاحظة: القناعة متوسطة فقط، لذا أبقِ حجم الصفقة صغيرًا.
لماذا البيع على المكشوف؟ التوصية تميل إلى البيع، إذ تتفق 3 من أصل 12 إشارة، وتعارضها إشارة واحدة، بينما 8 إشارات غير حاسمة.
• الاتجاه اليومي: السعر < EMA50 < EMA200، ترتيب هابط → الاتجاه العام هابط
• اتجاه 4 ساعات: السعر < EMA50 < EMA200، ترتيب هابط → اتجاه التأرجح هابط
• قوة الاتجاه (ADX/DI، إطار 15 دقيقة): ADX عند 29.0 والبائعون مسيطرون (DI+ 17.7 مقابل DI− 31.1) → البائعون يدفعون الحركة
المخاطر: مؤشر RSI لإطار 4 ساعات عند 59.3، والزخم صعودي (أعلى من 55) → المشترون يملكون الزخم
باختصار:
1/4 الاتجاه اليومي هابط، والسعر أدنى من EMA50 وEMA200، ما يعني أن الصورة العامة هابطة.
2/4 اتجاه 4 ساعات هابط أيضًا، والسعر أدنى من EMA50 وEMA200، ما يعني أن اتجاه التأرجح هابط.
3/4 قيمة ADX البالغة 29.0، مع DI السالب عند 31.1 مقابل DI الموجب عند 17.7، تعني أن البائعين يدفعون الحركة.
4/4 مؤشر RSI لإطار 4 ساعات عند 59.3، ما يشير إلى زخم صعودي أعلى من 55، لذا فالمشترون يملكون الزخم.
إذا كنت في صفقة شراء أو تخطط لتغيير اتجاهك، فما المستوى الذي ستعتمده للدفاع عن انحيازك؟
الإعداد الكامل موضح في الرسم البياني أدناه.
📲 هل تريد المزيد من أحدث إشاراتي؟ انضم إليّ هنا:
https://app.binance.com/uni-qr/D26WbL9t
⚠️ تحليل شخصي للسوق فقط. لا يُعد نصيحة مالية — أدر المخاطر وأجرِ بحثك الخاص.
محتوى تعليمي، وليس نصيحة استثمارية أو توصية بشراء أي أصل أو بيعه أو إيداعه أو سحبه. لا توجد إعلانات مدفوعة أو روابط إحالة/شراكة.
1
546
·
--
صاعد
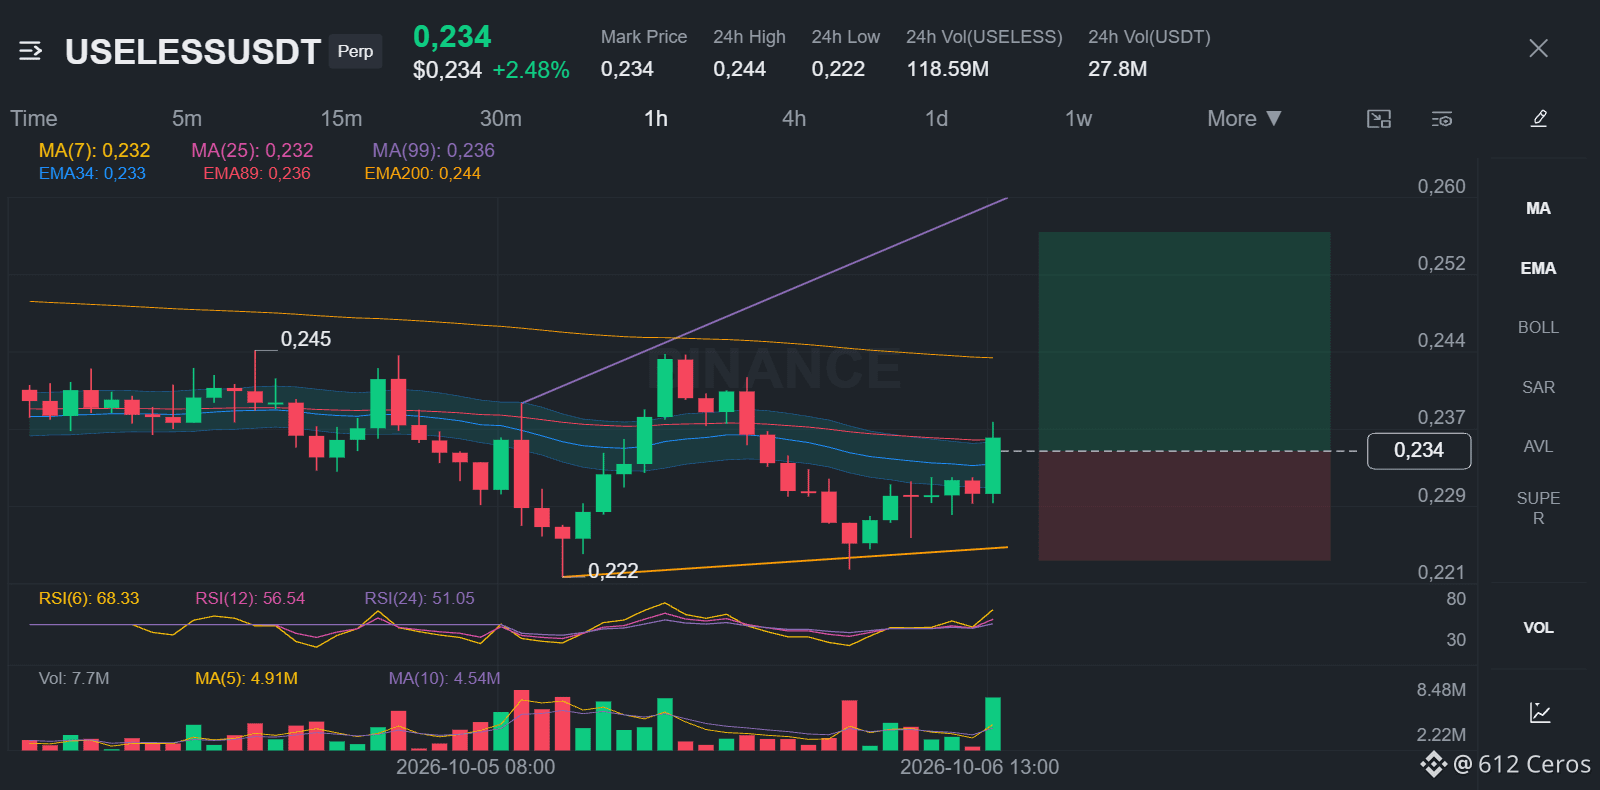
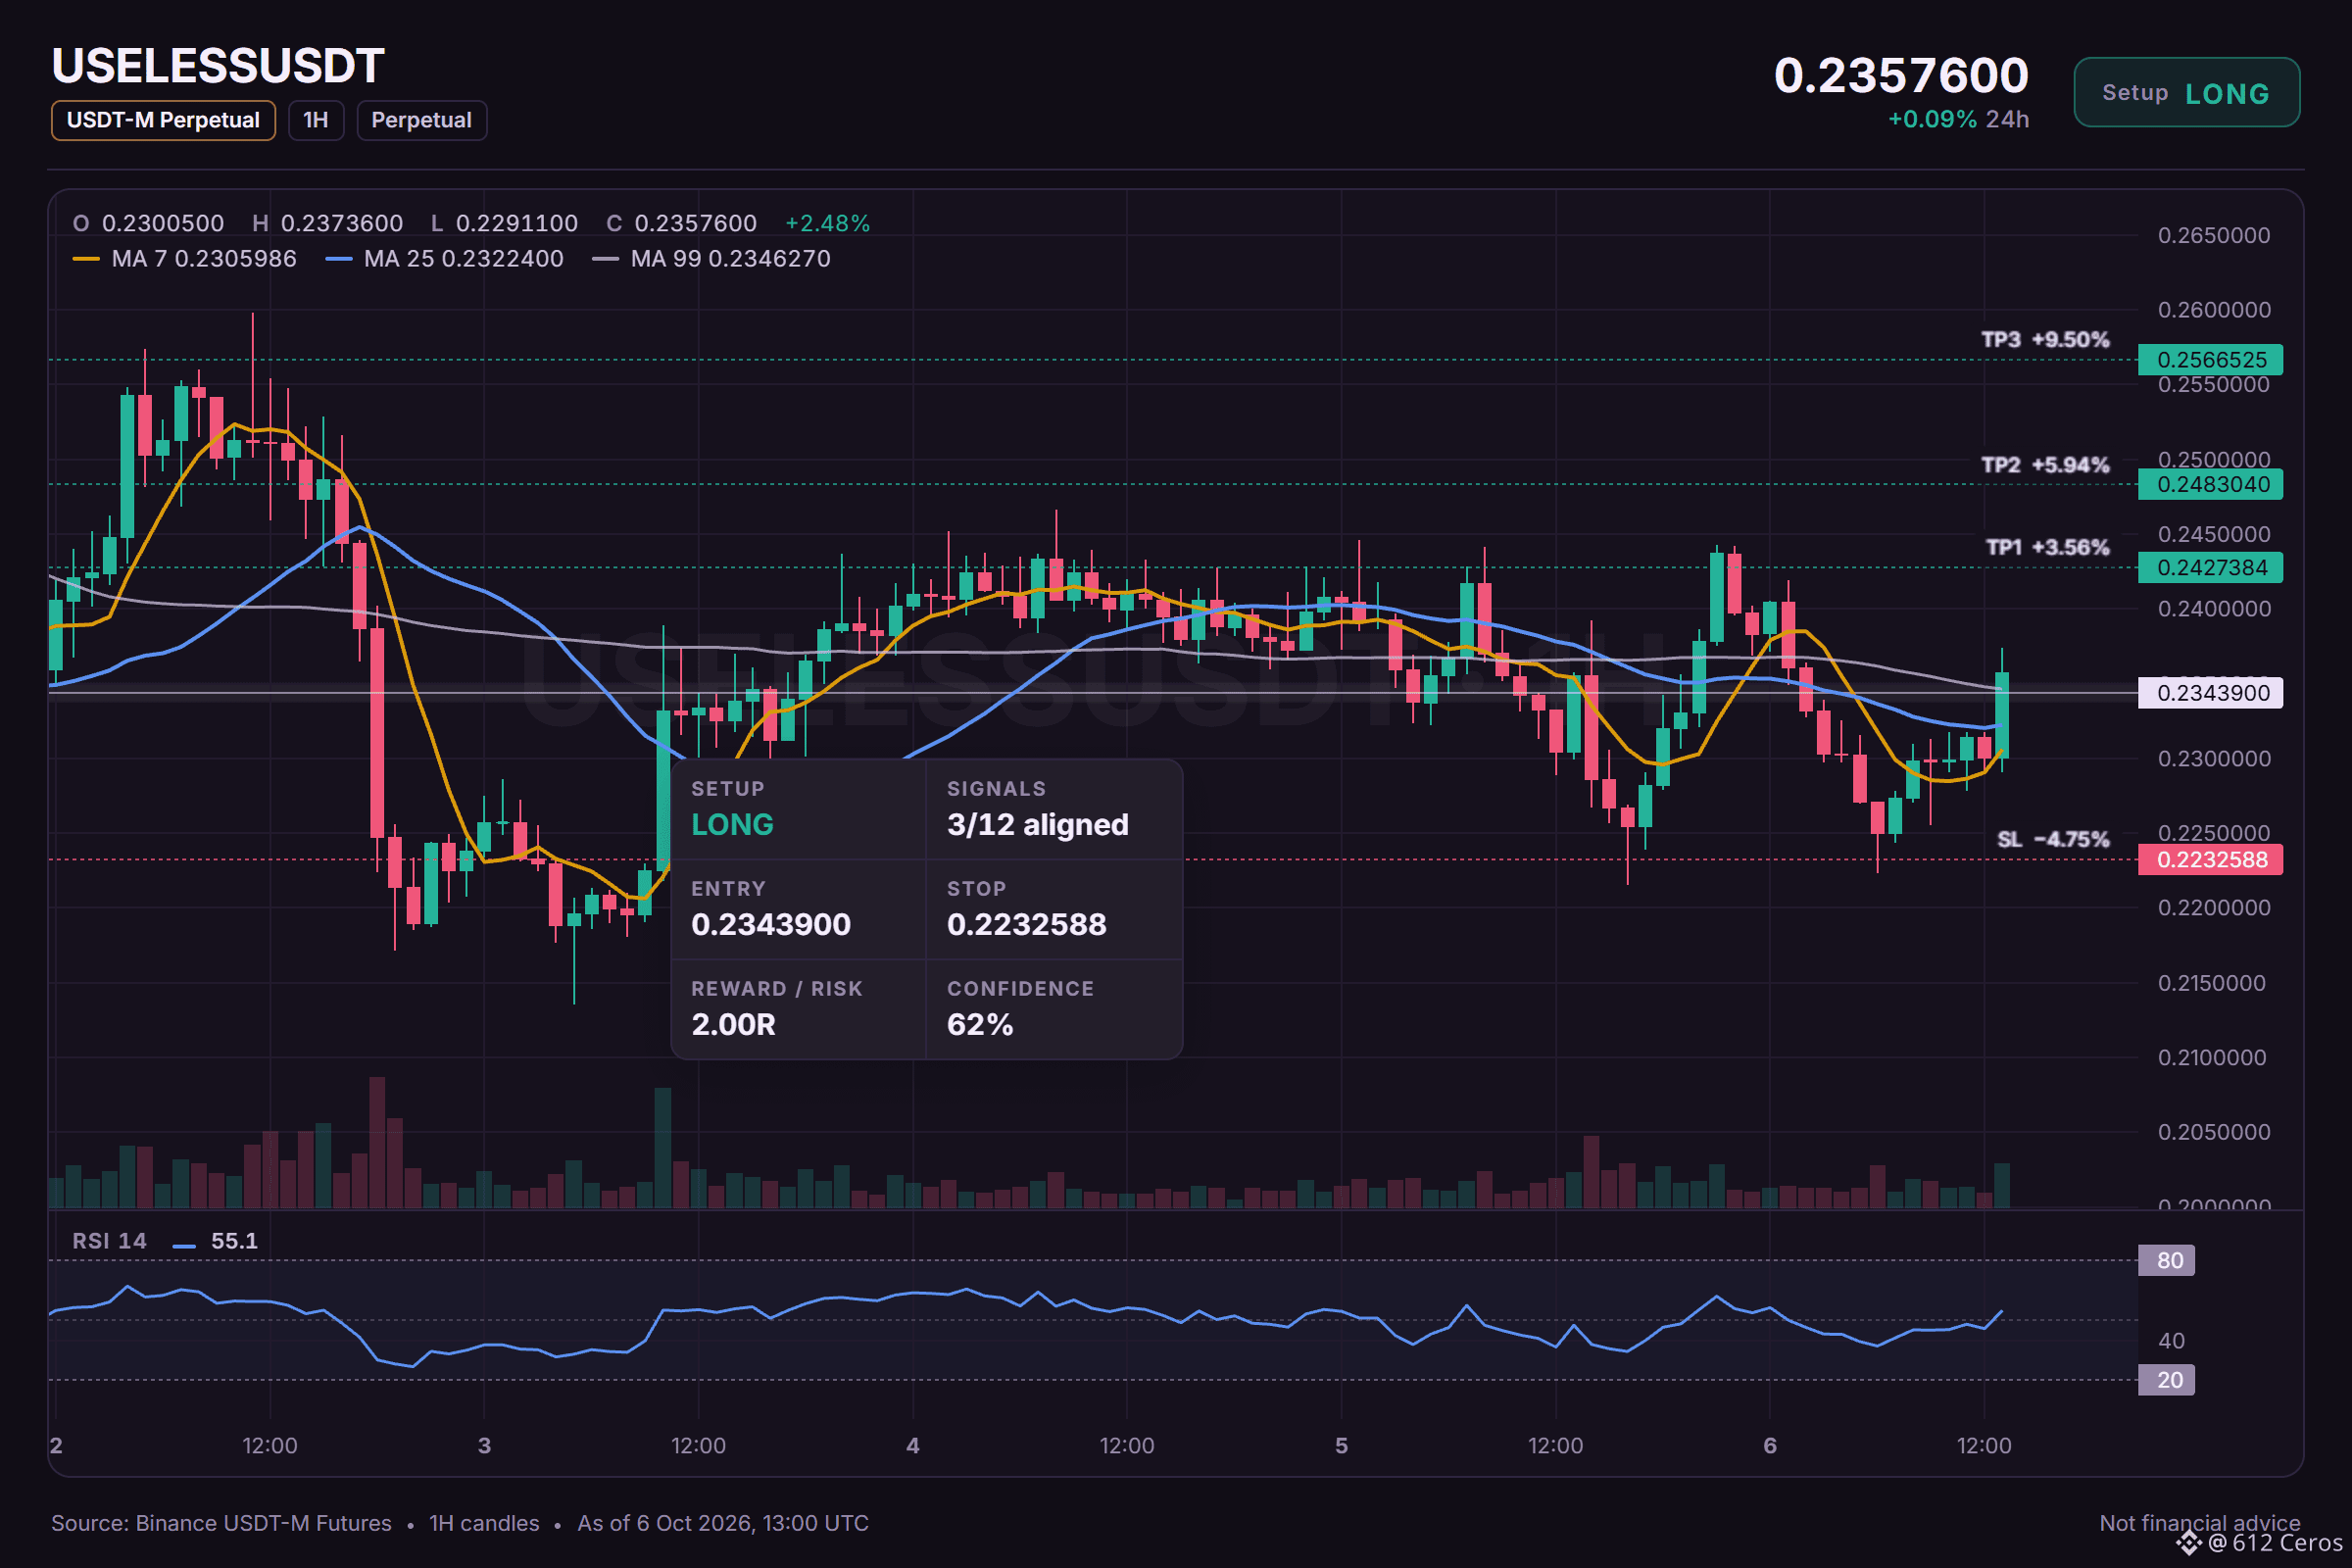
🟢 شراء $USELESS /USDT: توقع ارتفاع السعر
الانحياز: شراء · ميل للشراء
الدخول: 0.2337602 – 0.2350198
جني الأرباح 1: 0.2427384 (+3.6%)
جني الأرباح 2: 0.2483040 (+5.9%)
جني الأرباح 3: 0.2566525 (+9.5%)
وقف الخسارة: 0.2232588 (-4.7%)
الخطة: ادخل فقط ضمن النطاق، وجنِ نصف الأرباح عند الهدف الأول، ثم حرّك وقف الخسارة إلى سعر الدخول.
ملاحظة: الثقة متوسطة فقط، لذا اجعل حجم الصفقة صغيرًا.
تحافظ USELESS على تماسكها ما دام الاتجاه اليومي صاعدًا
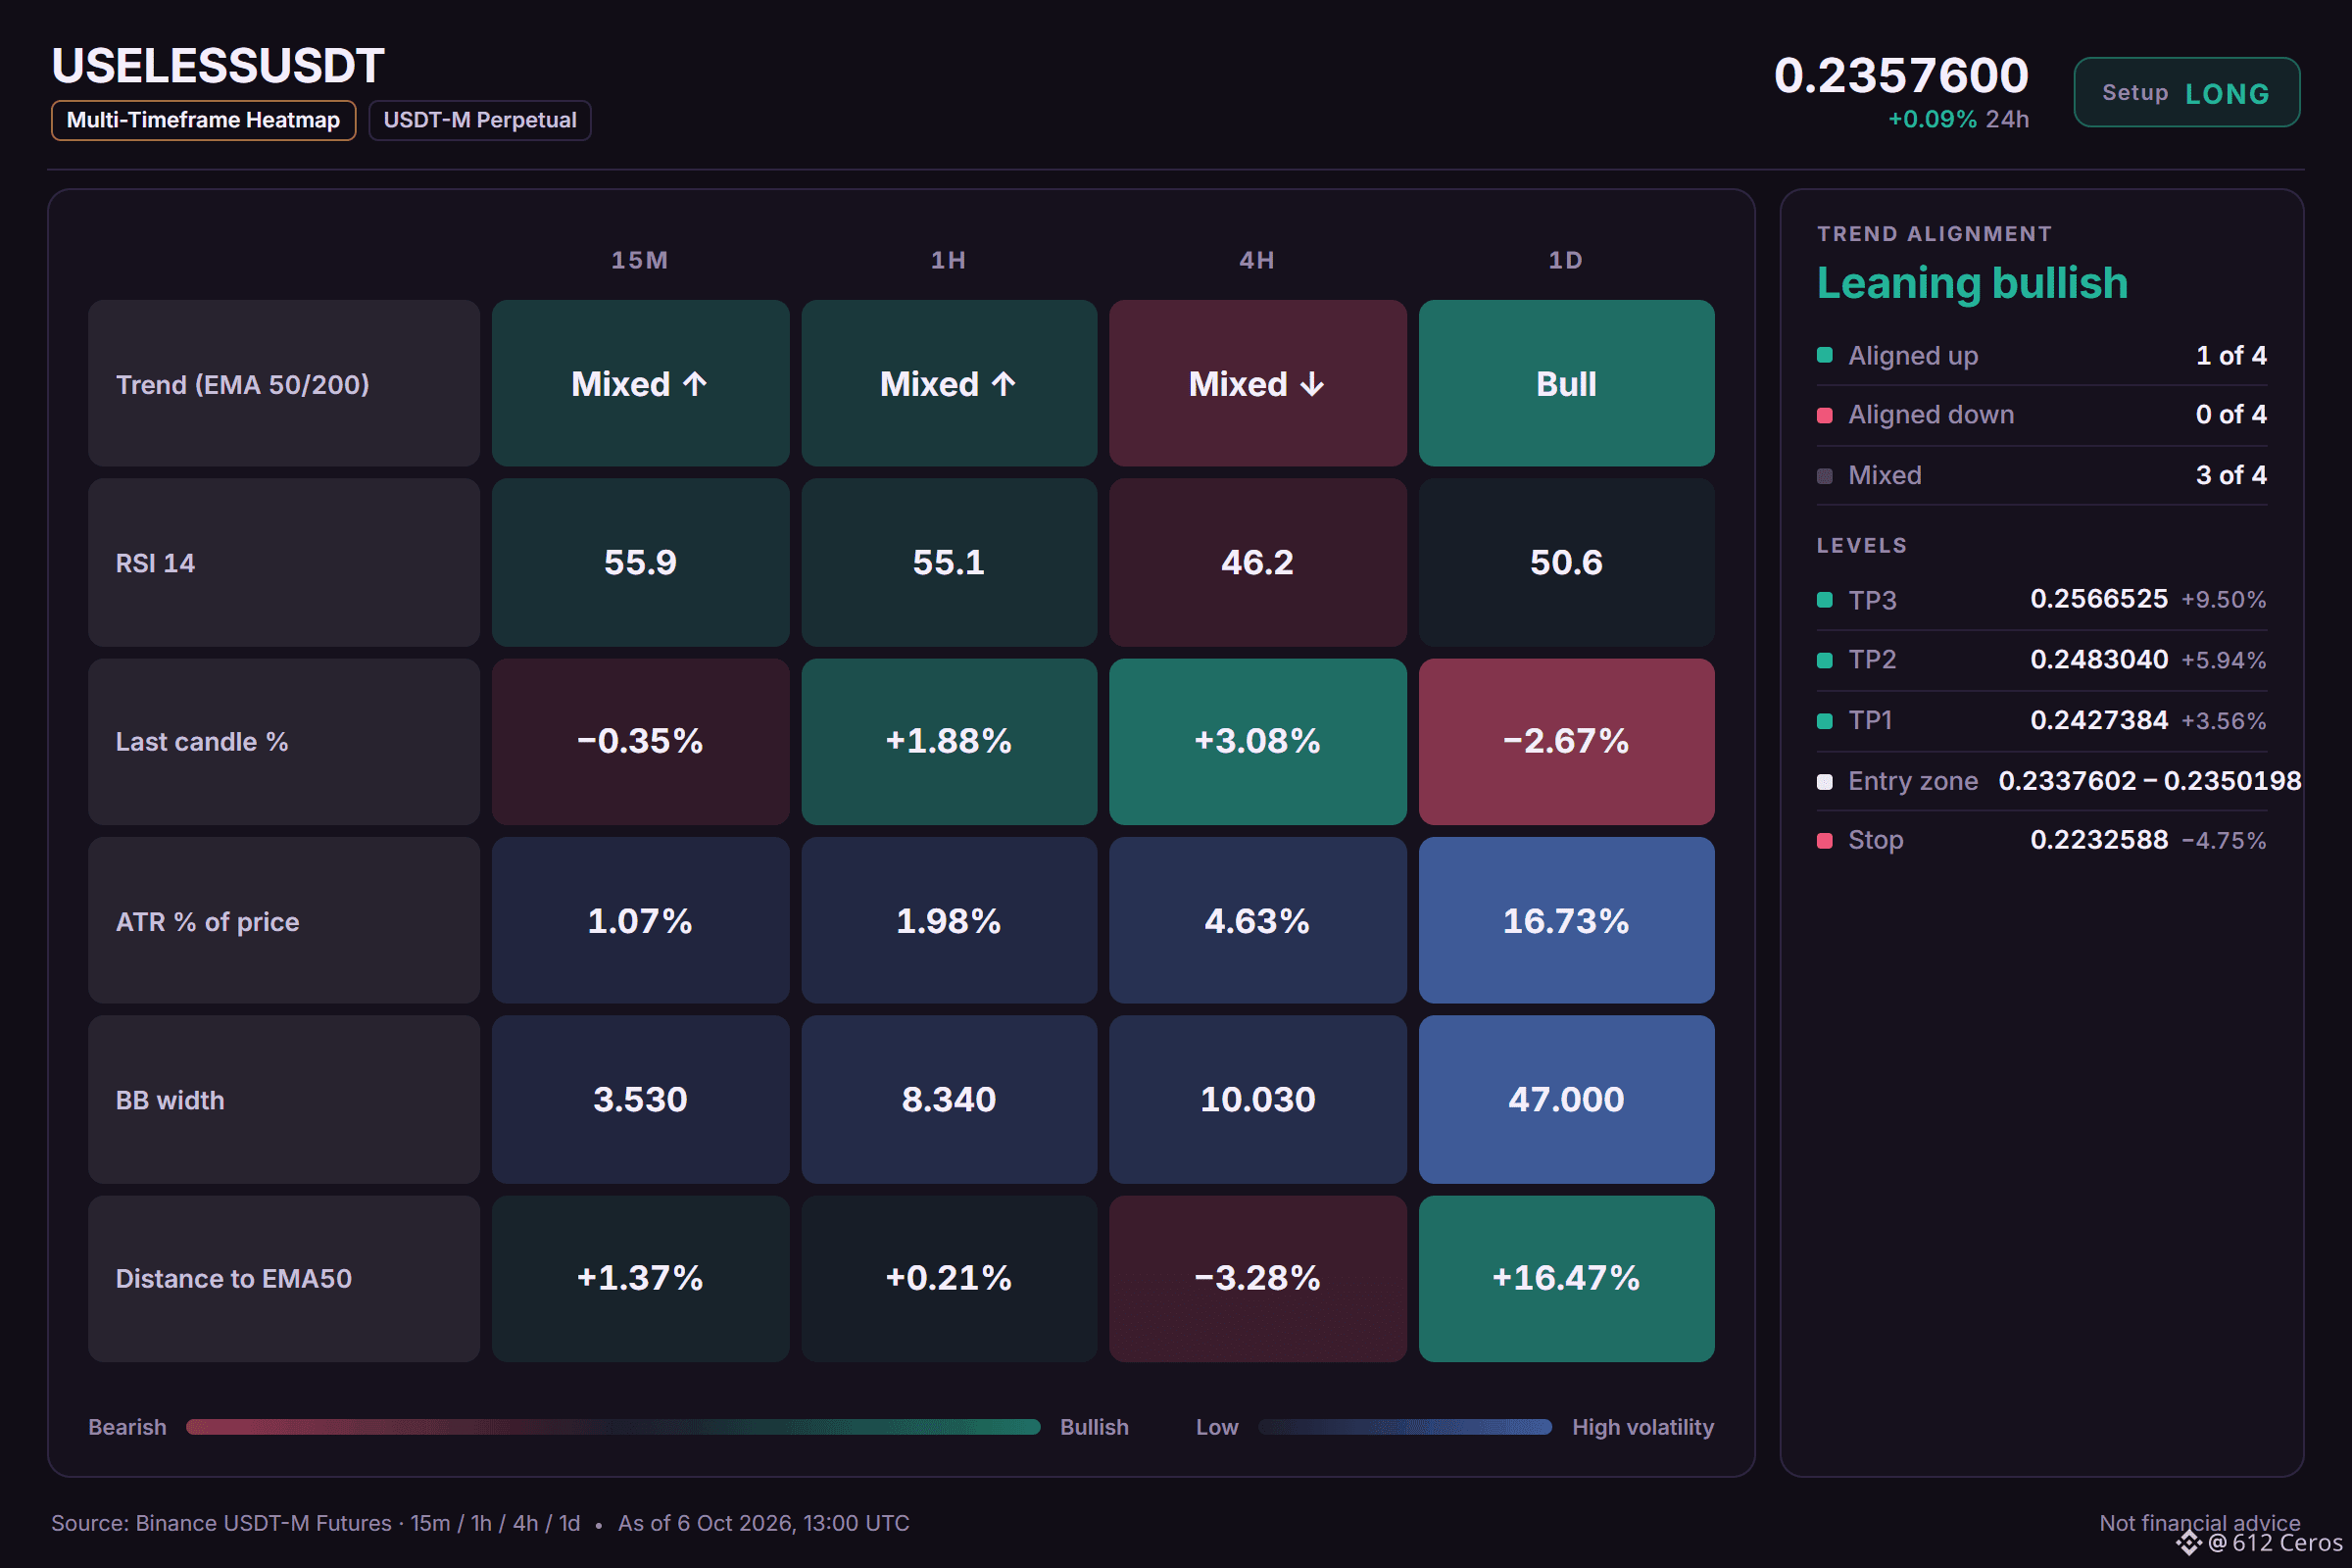
لماذا الشراء؟ التوجه يميل إلى الشراء؛ 3 من أصل 12 إشارة تؤيده، ولا توجد إشارات معاكسة، و9 لم تحسم موقفها.
• الاتجاه اليومي: السعر > EMA50 > EMA200، ترتيب صعودي → الاتجاه العام صاعد
• مؤشر RSI على إطار الساعة: 55.1، زخم صعودي (أعلى من 55) → المشترون يملكون الزخم
• القوة النسبية مقابل BTC: أداء أفضل، +1.41% مقارنةً بـ BTC خلال اليوم الماضي → أقوى من BTC
الاتجاه اليومي صعودي، ومؤشر RSI على إطار الساعة عند 55.85 يُظهر أن المشترين يملكون الزخم. يقع الدخول بالقرب من 0.2337602، مع تصنيف الثقة على أنها محدودة، لذا لا تزال بعض العوامل متعارضة.
أين ستضع وقف الخسارة لو كنت في الجانب الآخر من هذا المستوى؟
المستويات موضحة على الرسم البياني أدناه.
{future}(USELESSUSDT)
📲 هل تريد المزيد من أحدث إشاراتي؟ انضم إليّ هنا:
[https://app.binance.com/uni-qr/D26WbL9t](https://app.binance.com/uni-qr/D26WbL9t)
⚠️ تحليل شخصي للسوق فقط. NFA — أدر المخاطر بنفسك وأجرِ أبحاثك الخاصة.
محتوى تعليمي، وليس نصيحة استثمارية أو توصية بشراء أي أصل أو بيعه أو إيداعه أو سحبه. لا يوجد ترويج مدفوع أو روابط إحالة/تسويق بالعمولة.
🟢 شراء $USELESS /USDT: توقع ارتفاع السعر
الانحياز: شراء · ميل للشراء
الدخول: 0.2337602 – 0.2350198
جني الأرباح 1: 0.2427384 (+3.6%)
جني الأرباح 2: 0.2483040 (+5.9%)
جني الأرباح 3: 0.2566525 (+9.5%)
وقف الخسارة: 0.2232588 (-4.7%)
الخطة: ادخل فقط ضمن النطاق، وجنِ نصف الأرباح عند الهدف الأول، ثم حرّك وقف الخسارة إلى سعر الدخول.
ملاحظة: الثقة متوسطة فقط، لذا اجعل حجم الصفقة صغيرًا.
تحافظ USELESS على تماسكها ما دام الاتجاه اليومي صاعدًا
لماذا الشراء؟ التوجه يميل إلى الشراء؛ 3 من أصل 12 إشارة تؤيده، ولا توجد إشارات معاكسة، و9 لم تحسم موقفها.
• الاتجاه اليومي: السعر > EMA50 > EMA200، ترتيب صعودي → الاتجاه العام صاعد
• مؤشر RSI على إطار الساعة: 55.1، زخم صعودي (أعلى من 55) → المشترون يملكون الزخم
• القوة النسبية مقابل BTC: أداء أفضل، +1.41% مقارنةً بـ BTC خلال اليوم الماضي → أقوى من BTC
الاتجاه اليومي صعودي، ومؤشر RSI على إطار الساعة عند 55.85 يُظهر أن المشترين يملكون الزخم. يقع الدخول بالقرب من 0.2337602، مع تصنيف الثقة على أنها محدودة، لذا لا تزال بعض العوامل متعارضة.
أين ستضع وقف الخسارة لو كنت في الجانب الآخر من هذا المستوى؟
المستويات موضحة على الرسم البياني أدناه.
📲 هل تريد المزيد من أحدث إشاراتي؟ انضم إليّ هنا:
https://app.binance.com/uni-qr/D26WbL9t
⚠️ تحليل شخصي للسوق فقط. NFA — أدر المخاطر بنفسك وأجرِ أبحاثك الخاصة.
محتوى تعليمي، وليس نصيحة استثمارية أو توصية بشراء أي أصل أو بيعه أو إيداعه أو سحبه. لا يوجد ترويج مدفوع أو روابط إحالة/تسويق بالعمولة.
الانحياز: شراء · ميل للشراء
الدخول: 0.2337602 – 0.2350198
جني الأرباح 1: 0.2427384 (+3.6%)
جني الأرباح 2: 0.2483040 (+5.9%)
جني الأرباح 3: 0.2566525 (+9.5%)
وقف الخسارة: 0.2232588 (-4.7%)
الخطة: ادخل فقط ضمن النطاق، وجنِ نصف الأرباح عند الهدف الأول، ثم حرّك وقف الخسارة إلى سعر الدخول.
ملاحظة: الثقة متوسطة فقط، لذا اجعل حجم الصفقة صغيرًا.
تحافظ USELESS على تماسكها ما دام الاتجاه اليومي صاعدًا
لماذا الشراء؟ التوجه يميل إلى الشراء؛ 3 من أصل 12 إشارة تؤيده، ولا توجد إشارات معاكسة، و9 لم تحسم موقفها.
• الاتجاه اليومي: السعر > EMA50 > EMA200، ترتيب صعودي → الاتجاه العام صاعد
• مؤشر RSI على إطار الساعة: 55.1، زخم صعودي (أعلى من 55) → المشترون يملكون الزخم
• القوة النسبية مقابل BTC: أداء أفضل، +1.41% مقارنةً بـ BTC خلال اليوم الماضي → أقوى من BTC
الاتجاه اليومي صعودي، ومؤشر RSI على إطار الساعة عند 55.85 يُظهر أن المشترين يملكون الزخم. يقع الدخول بالقرب من 0.2337602، مع تصنيف الثقة على أنها محدودة، لذا لا تزال بعض العوامل متعارضة.
أين ستضع وقف الخسارة لو كنت في الجانب الآخر من هذا المستوى؟
المستويات موضحة على الرسم البياني أدناه.
📲 هل تريد المزيد من أحدث إشاراتي؟ انضم إليّ هنا:
https://app.binance.com/uni-qr/D26WbL9t
⚠️ تحليل شخصي للسوق فقط. NFA — أدر المخاطر بنفسك وأجرِ أبحاثك الخاصة.
محتوى تعليمي، وليس نصيحة استثمارية أو توصية بشراء أي أصل أو بيعه أو إيداعه أو سحبه. لا يوجد ترويج مدفوع أو روابط إحالة/تسويق بالعمولة.
501
·
--
صاعد
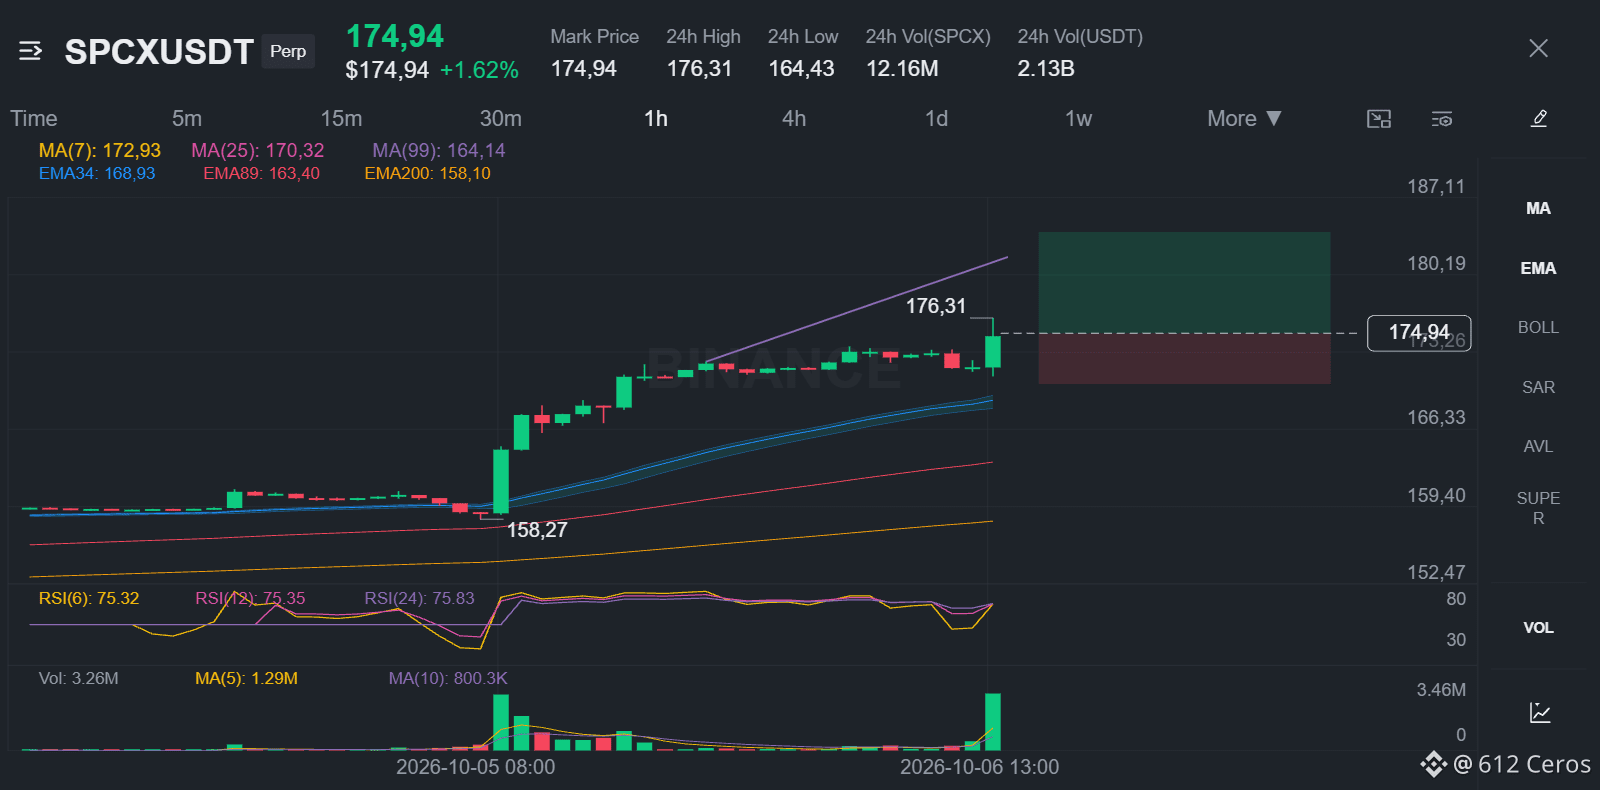
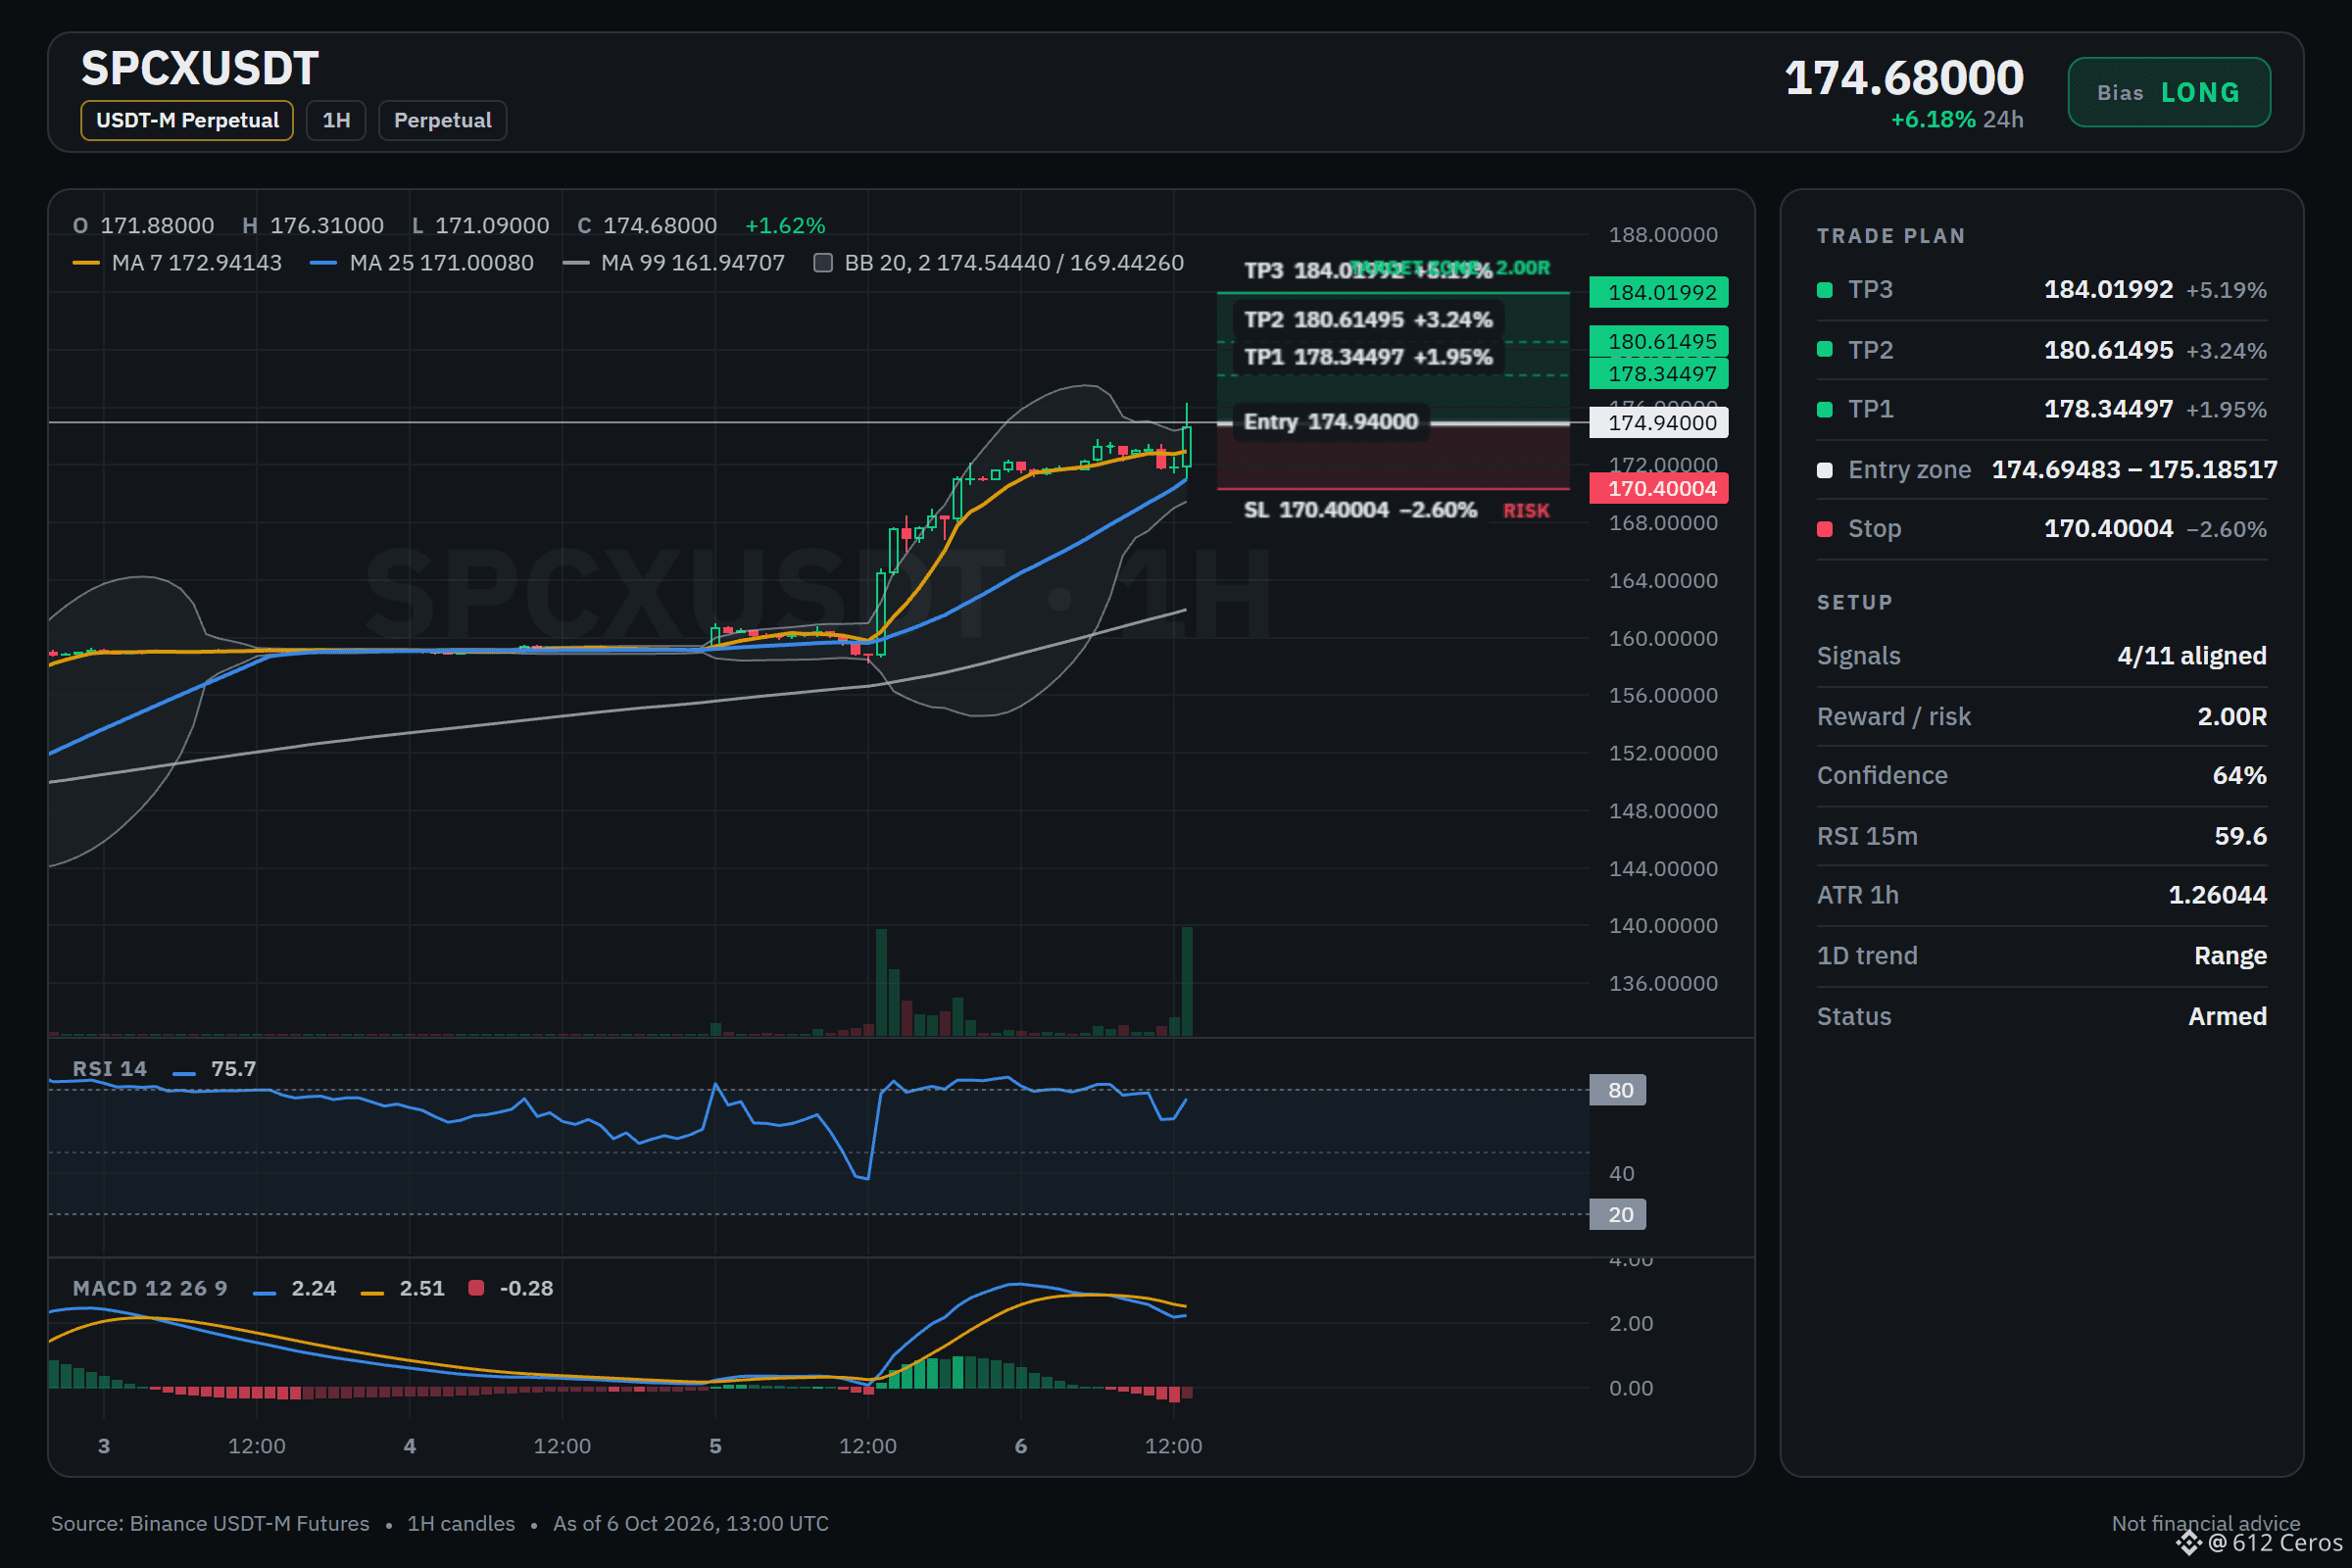
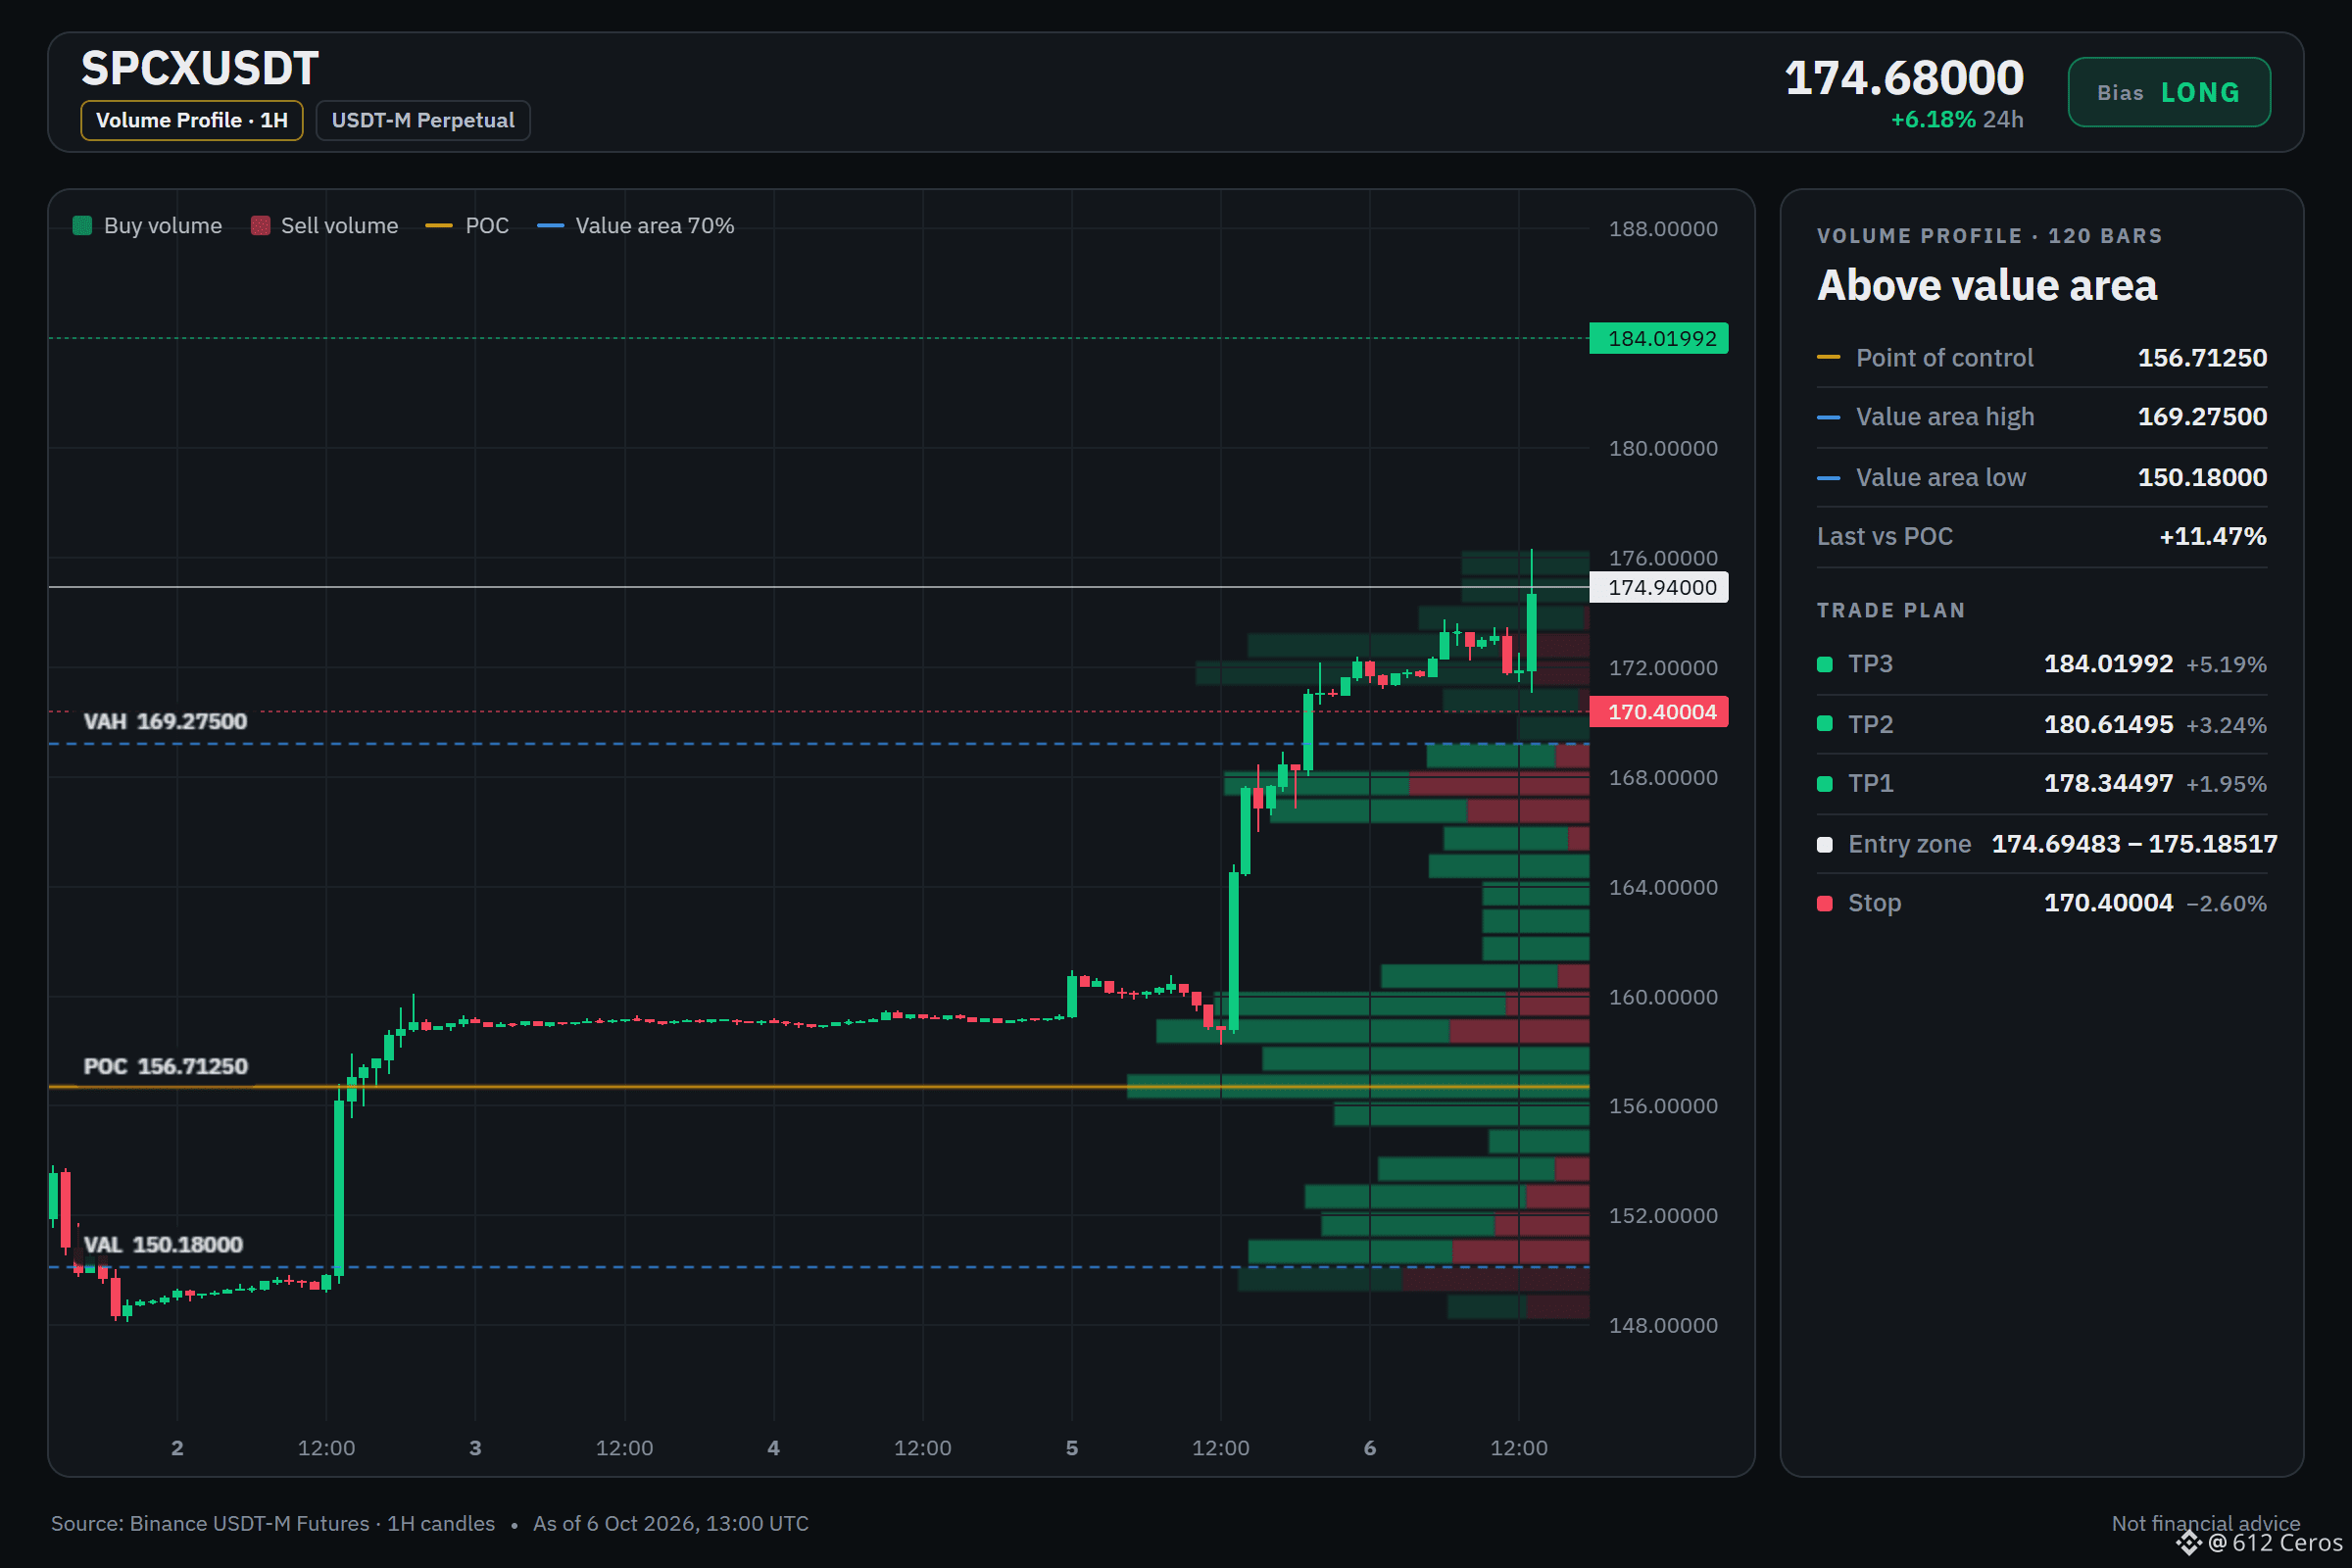
إعداد صفقة شراء طويلة على SPCX: المستويات التي أراقبها
🟢 شراء طويل $SPCX /USDT: أتوقع ارتفاع السعر
الانحياز: شراء طويل · ميل للصعود
الدخول: 174.69483 – 175.18517
جني الأرباح 1: 178.34497 (+1.9%)
جني الأرباح 2: 180.61495 (+3.2%)
جني الأرباح 3: 184.01992 (+5.2%)
وقف الخسارة: 170.40004 (-2.6%)
الخطة: ادخل داخل النطاق فقط، وبِع نصف الكمية عند جني الأرباح 1، ثم انقل وقف الخسارة إلى سعر الدخول.
ملاحظة: القناعة متوسطة فحسب، لذا أبقِ حجم الصفقة صغيرًا.
لماذا الشراء الطويل؟ الميل يشير إلى الشراء، إذ تتفق 4 من أصل 11 إشارة، وتعارضه إشارة واحدة، فيما لم تحسم 6 إشارات موقفها.
• اتجاه 4 ساعات: السعر > EMA50 > EMA200، ترتيب صعودي → اتجاه التأرجح صاعد
• اتجاه ساعة واحدة: السعر > EMA50 > EMA200، ترتيب صعودي → الاتجاه قصير الأجل صاعد
• قوة الاتجاه (ADX/DI، 15 دقيقة): ADX عند 29.7 والمشترون يسيطرون (DI+ عند 32.3 مقابل DI− عند 13.8) → المشترون يدفعون الحركة
المخاطر: RSI لأربع ساعات: 79.6، في منطقة تشبع شرائي: قوي لكنه مفرط → ارتفع السعر بسرعة، والتراجعات شائعة من هذه المستويات
لماذا الآن؟
يشير الاتجاه اليومي إلى نطاق عرضي، وتؤيد 4 من أصل 11 إشارة الدخول في صفقة شراء طويلة. تقضي الخطة بالتداول ضمن نطاق 174.69483 – 175.18517، وجني الأرباح تدريجيًا عند 178.34497 و180.61495، والتحلي بالصبر انتظارًا للوصول إلى 184.01992. تجاوز مستوى 170.40004 يعني أن الفكرة غير صحيحة، وعندها يؤدي وقف الخسارة مهمته.
هل يصل SPCX إلى 178.34497 أولًا أم إلى وقف الخسارة؟
المستويات موضحة على الرسم البياني أدناه.
{future}(SPCXUSDT)
📲 أتريد المزيد من أحدث إشاراتي؟ انضم إليّ هنا:
[https://app.binance.com/uni-qr/D26WbL9t](https://app.binance.com/uni-qr/D26WbL9t)
⚠️ هذا تحليل شخصي للسوق فقط. لا يُعد نصيحة مالية — أدر المخاطر وأجرِ أبحاثك الخاصة.
محتوى تعليمي، وليس نصيحة استثمارية أو توصية بشراء أي أصل أو بيعه أو إيداعه أو سحبه. لا يوجد ترويج مدفوع أو روابط إحالة/تسويق بالعمولة.
إعداد صفقة شراء طويلة على SPCX: المستويات التي أراقبها
🟢 شراء طويل $SPCX /USDT: أتوقع ارتفاع السعر
الانحياز: شراء طويل · ميل للصعود
الدخول: 174.69483 – 175.18517
جني الأرباح 1: 178.34497 (+1.9%)
جني الأرباح 2: 180.61495 (+3.2%)
جني الأرباح 3: 184.01992 (+5.2%)
وقف الخسارة: 170.40004 (-2.6%)
الخطة: ادخل داخل النطاق فقط، وبِع نصف الكمية عند جني الأرباح 1، ثم انقل وقف الخسارة إلى سعر الدخول.
ملاحظة: القناعة متوسطة فحسب، لذا أبقِ حجم الصفقة صغيرًا.
لماذا الشراء الطويل؟ الميل يشير إلى الشراء، إذ تتفق 4 من أصل 11 إشارة، وتعارضه إشارة واحدة، فيما لم تحسم 6 إشارات موقفها.
• اتجاه 4 ساعات: السعر > EMA50 > EMA200، ترتيب صعودي → اتجاه التأرجح صاعد
• اتجاه ساعة واحدة: السعر > EMA50 > EMA200، ترتيب صعودي → الاتجاه قصير الأجل صاعد
• قوة الاتجاه (ADX/DI، 15 دقيقة): ADX عند 29.7 والمشترون يسيطرون (DI+ عند 32.3 مقابل DI− عند 13.8) → المشترون يدفعون الحركة
المخاطر: RSI لأربع ساعات: 79.6، في منطقة تشبع شرائي: قوي لكنه مفرط → ارتفع السعر بسرعة، والتراجعات شائعة من هذه المستويات
لماذا الآن؟
يشير الاتجاه اليومي إلى نطاق عرضي، وتؤيد 4 من أصل 11 إشارة الدخول في صفقة شراء طويلة. تقضي الخطة بالتداول ضمن نطاق 174.69483 – 175.18517، وجني الأرباح تدريجيًا عند 178.34497 و180.61495، والتحلي بالصبر انتظارًا للوصول إلى 184.01992. تجاوز مستوى 170.40004 يعني أن الفكرة غير صحيحة، وعندها يؤدي وقف الخسارة مهمته.
هل يصل SPCX إلى 178.34497 أولًا أم إلى وقف الخسارة؟
المستويات موضحة على الرسم البياني أدناه.
📲 أتريد المزيد من أحدث إشاراتي؟ انضم إليّ هنا:
https://app.binance.com/uni-qr/D26WbL9t
⚠️ هذا تحليل شخصي للسوق فقط. لا يُعد نصيحة مالية — أدر المخاطر وأجرِ أبحاثك الخاصة.
محتوى تعليمي، وليس نصيحة استثمارية أو توصية بشراء أي أصل أو بيعه أو إيداعه أو سحبه. لا يوجد ترويج مدفوع أو روابط إحالة/تسويق بالعمولة.
🟢 شراء طويل $SPCX /USDT: أتوقع ارتفاع السعر
الانحياز: شراء طويل · ميل للصعود
الدخول: 174.69483 – 175.18517
جني الأرباح 1: 178.34497 (+1.9%)
جني الأرباح 2: 180.61495 (+3.2%)
جني الأرباح 3: 184.01992 (+5.2%)
وقف الخسارة: 170.40004 (-2.6%)
الخطة: ادخل داخل النطاق فقط، وبِع نصف الكمية عند جني الأرباح 1، ثم انقل وقف الخسارة إلى سعر الدخول.
ملاحظة: القناعة متوسطة فحسب، لذا أبقِ حجم الصفقة صغيرًا.
لماذا الشراء الطويل؟ الميل يشير إلى الشراء، إذ تتفق 4 من أصل 11 إشارة، وتعارضه إشارة واحدة، فيما لم تحسم 6 إشارات موقفها.
• اتجاه 4 ساعات: السعر > EMA50 > EMA200، ترتيب صعودي → اتجاه التأرجح صاعد
• اتجاه ساعة واحدة: السعر > EMA50 > EMA200، ترتيب صعودي → الاتجاه قصير الأجل صاعد
• قوة الاتجاه (ADX/DI، 15 دقيقة): ADX عند 29.7 والمشترون يسيطرون (DI+ عند 32.3 مقابل DI− عند 13.8) → المشترون يدفعون الحركة
المخاطر: RSI لأربع ساعات: 79.6، في منطقة تشبع شرائي: قوي لكنه مفرط → ارتفع السعر بسرعة، والتراجعات شائعة من هذه المستويات
لماذا الآن؟
يشير الاتجاه اليومي إلى نطاق عرضي، وتؤيد 4 من أصل 11 إشارة الدخول في صفقة شراء طويلة. تقضي الخطة بالتداول ضمن نطاق 174.69483 – 175.18517، وجني الأرباح تدريجيًا عند 178.34497 و180.61495، والتحلي بالصبر انتظارًا للوصول إلى 184.01992. تجاوز مستوى 170.40004 يعني أن الفكرة غير صحيحة، وعندها يؤدي وقف الخسارة مهمته.
هل يصل SPCX إلى 178.34497 أولًا أم إلى وقف الخسارة؟
المستويات موضحة على الرسم البياني أدناه.
📲 أتريد المزيد من أحدث إشاراتي؟ انضم إليّ هنا:
https://app.binance.com/uni-qr/D26WbL9t
⚠️ هذا تحليل شخصي للسوق فقط. لا يُعد نصيحة مالية — أدر المخاطر وأجرِ أبحاثك الخاصة.
محتوى تعليمي، وليس نصيحة استثمارية أو توصية بشراء أي أصل أو بيعه أو إيداعه أو سحبه. لا يوجد ترويج مدفوع أو روابط إحالة/تسويق بالعمولة.
2
1.1k
·
--
هابط
يتجه SNDK نحو الانخفاض، والبائعون يسيطرون.
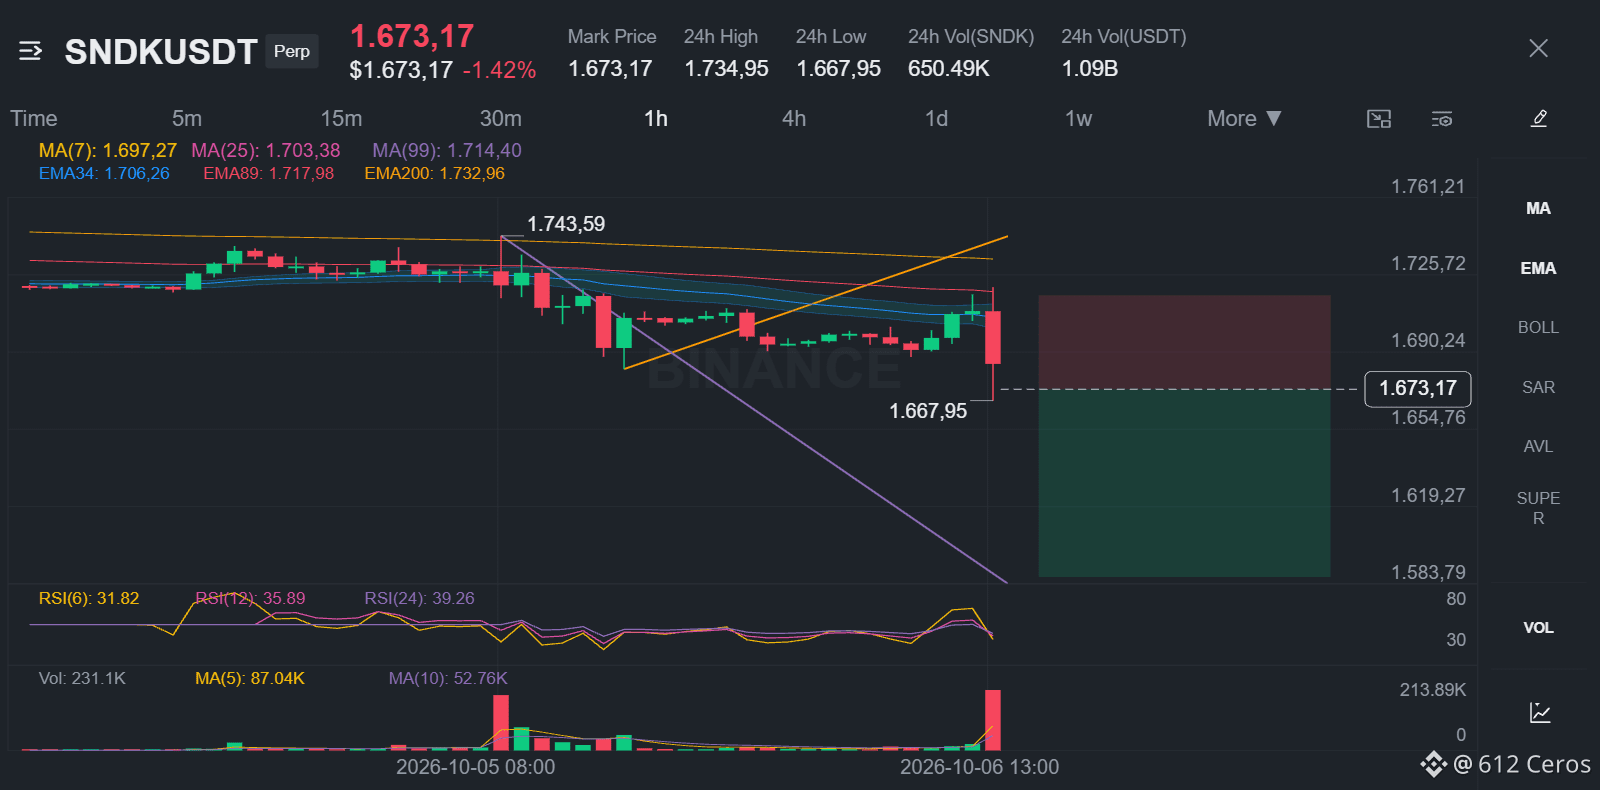
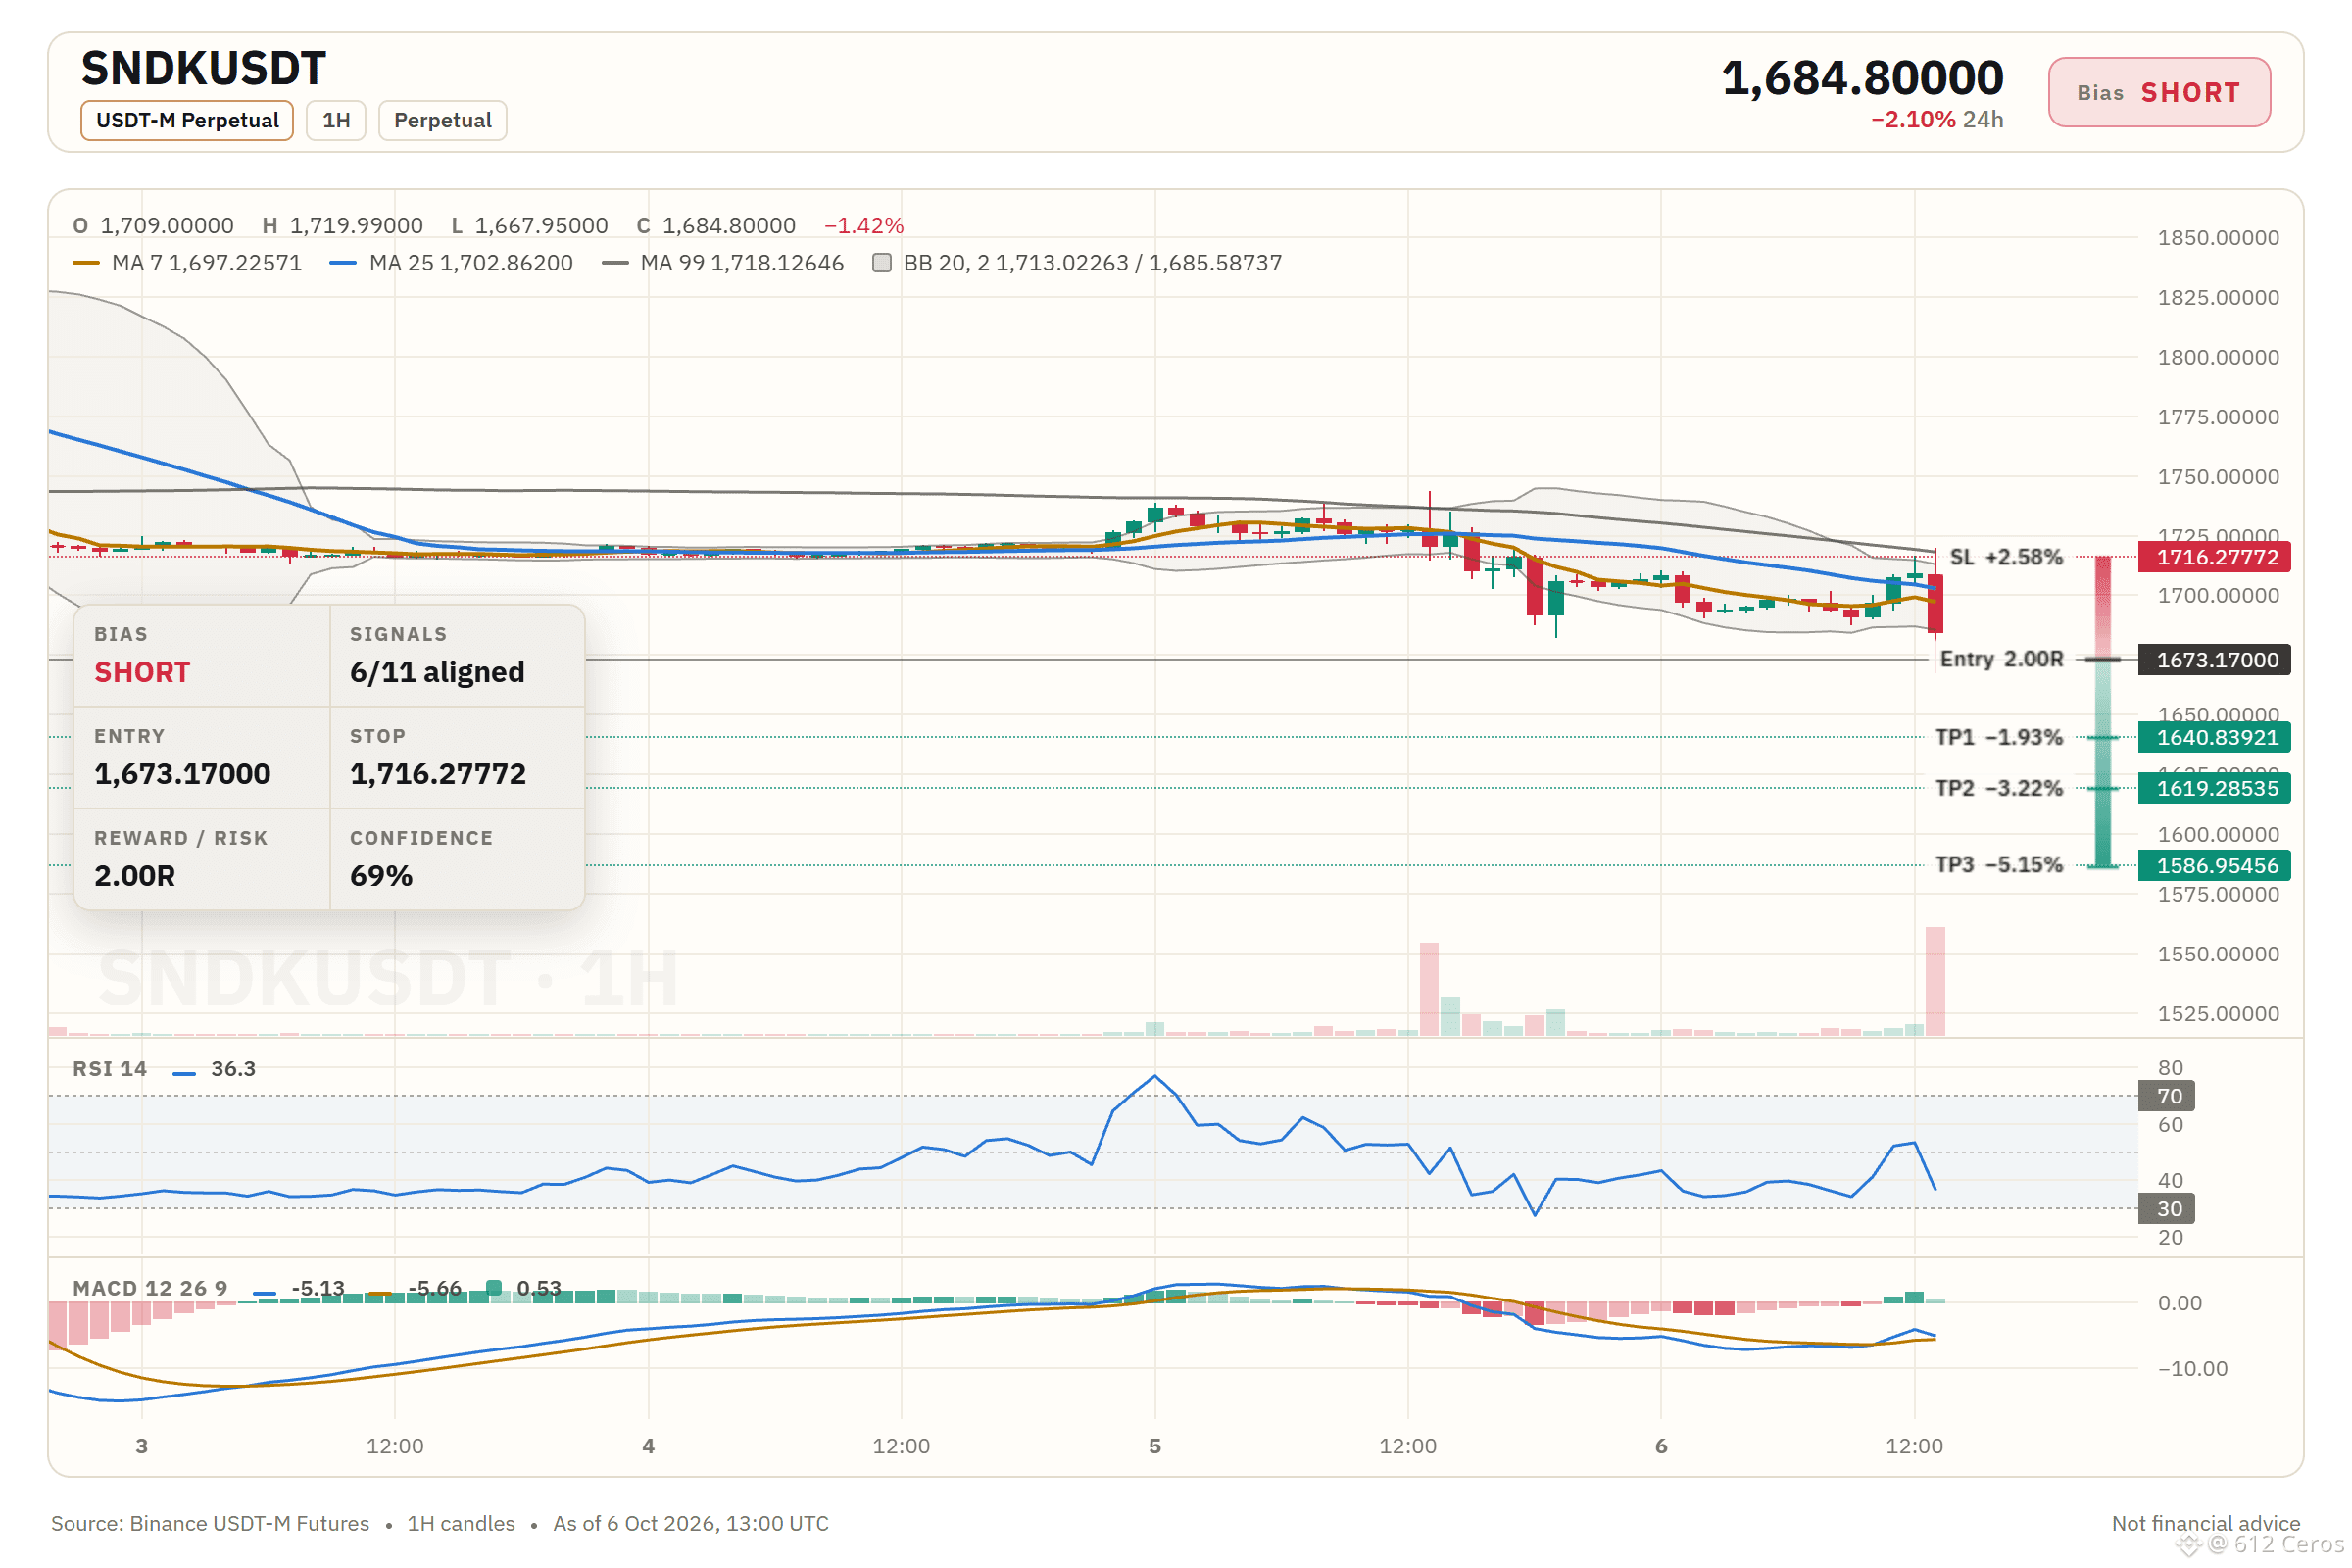
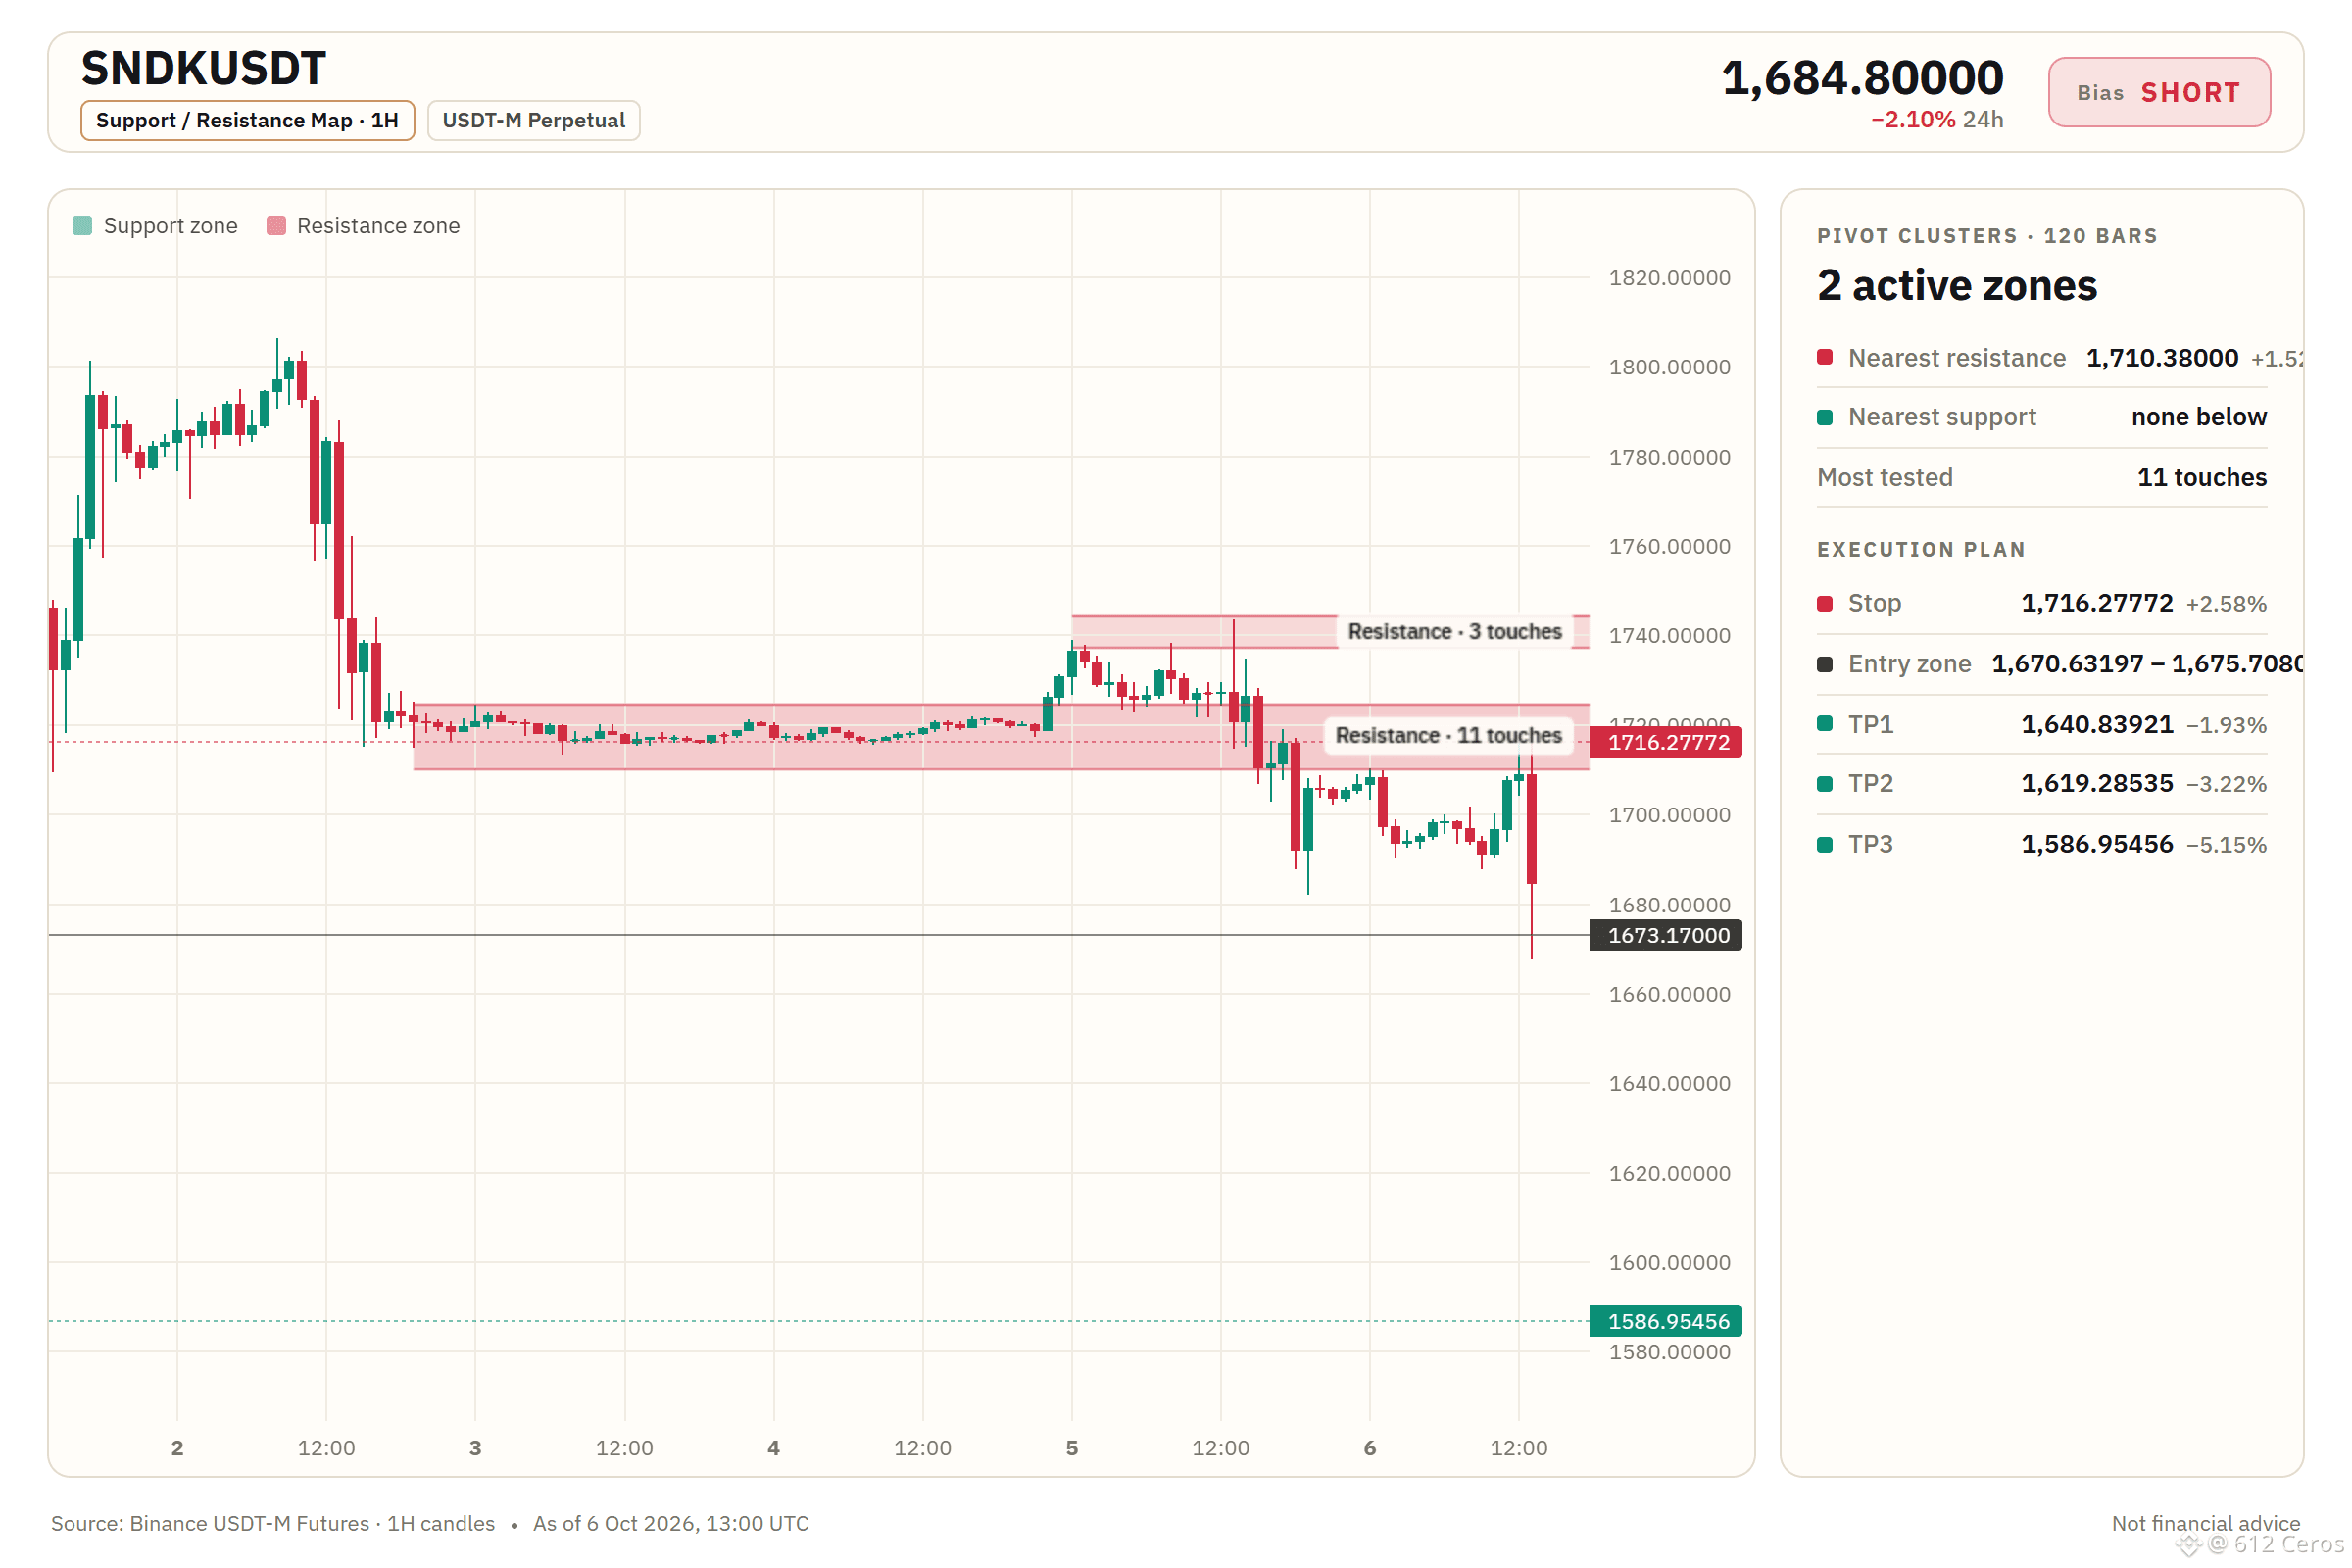
🔴 بيع على المكشوف $SNDK /USDT: توقع انخفاض السعر
الاتجاه: بيع على المكشوف · قوي
الدخول: 1670.63197 – 1675.70803
الهدف 1: 1640.83921 (-1.9%)
الهدف 2: 1619.28535 (-3.2%)
الهدف 3: 1586.95456 (-5.2%)
وقف الخسارة: 1716.27772 (+2.6%)
الخطة: ادخل فقط ضمن النطاق، وخذ نصف الكمية عند الهدف 1، ثم انقل وقف الخسارة إلى سعر الدخول.
لماذا البيع على المكشوف؟ إشارة قوية، 6/11 من الإشارات تؤيدها، وإشارة واحدة تعارضها، و4 غير حاسمة.
• اتجاه الساعة: السعر < EMA50 < EMA200، وتراص هابط → الاتجاه قصير الأجل هابط
• قوة الاتجاه (ADX/DI، 15 دقيقة): ADX عند 29.9 مع سيطرة البائعين (DI+ 10.8 مقابل DI− 27.2) → البائعون يقودون الحركة
• مؤشر RSI لأربع ساعات: 42.2، زخم هابط (دون 45) → الزخم في صالح البائعين
المخاطر: المسافة عن EMA50 على إطار الساعة: −3.1 ATR من EMA50 للساعة، والسعر مفرط في الابتعاد مع احتمال الارتداد → هبط السعر كثيرًا دون متوسطه، لذا يُرجح حدوث ارتداد
قراءتي لـ SNDK اليوم
أراقب SNDK لأن السعر على إطار الساعة يقع دون EMA50 وEMA200، كما أن RSI على إطار الساعة عند 36.3 يشير إلى زخم هابط. أريد أن أرى مستوى إبطال الصفقة عند الحد الأعلى للدخول 1675.70803 يصمد، حتى تتجه صفقة البيع على المكشوف نحو الهدف الأول قرب 1640.83921. أقوى إشارة هي اتجاه الساعة مع تراص المتوسطات الهابط، أما الخطر الرئيسي فهو أن السعر يقل 3.1 ATR عن EMA50، ما يعني أن الارتداد مرجح.
هل أنت مرتاح للبيع على المكشوف عند هذا المستوى، أم ستنتظر حتى يستعيد السعر الحد الأدنى للدخول عند 1670.63197؟
الرسم البياني مع جميع المستويات أدناه.
{future}(SNDKUSDT)
📲 هل تريد المزيد من أحدث إشاراتي؟ انضم إليّ هنا:
[https://app.binance.com/uni-qr/D26WbL9t](https://app.binance.com/uni-qr/D26WbL9t)
⚠️ تحليل شخصي للسوق فقط. NFA — أدر المخاطر بنفسك وأجرِ أبحاثك الخاصة.
محتوى تعليمي، وليس نصيحة استثمارية أو توصية بشراء أي أصل أو بيعه أو إيداعه أو سحبه. لا توجد عروض ترويجية مدفوعة أو روابط إحالة/عمولة.
يتجه SNDK نحو الانخفاض، والبائعون يسيطرون.
🔴 بيع على المكشوف $SNDK /USDT: توقع انخفاض السعر
الاتجاه: بيع على المكشوف · قوي
الدخول: 1670.63197 – 1675.70803
الهدف 1: 1640.83921 (-1.9%)
الهدف 2: 1619.28535 (-3.2%)
الهدف 3: 1586.95456 (-5.2%)
وقف الخسارة: 1716.27772 (+2.6%)
الخطة: ادخل فقط ضمن النطاق، وخذ نصف الكمية عند الهدف 1، ثم انقل وقف الخسارة إلى سعر الدخول.
لماذا البيع على المكشوف؟ إشارة قوية، 6/11 من الإشارات تؤيدها، وإشارة واحدة تعارضها، و4 غير حاسمة.
• اتجاه الساعة: السعر < EMA50 < EMA200، وتراص هابط → الاتجاه قصير الأجل هابط
• قوة الاتجاه (ADX/DI، 15 دقيقة): ADX عند 29.9 مع سيطرة البائعين (DI+ 10.8 مقابل DI− 27.2) → البائعون يقودون الحركة
• مؤشر RSI لأربع ساعات: 42.2، زخم هابط (دون 45) → الزخم في صالح البائعين
المخاطر: المسافة عن EMA50 على إطار الساعة: −3.1 ATR من EMA50 للساعة، والسعر مفرط في الابتعاد مع احتمال الارتداد → هبط السعر كثيرًا دون متوسطه، لذا يُرجح حدوث ارتداد
قراءتي لـ SNDK اليوم
أراقب SNDK لأن السعر على إطار الساعة يقع دون EMA50 وEMA200، كما أن RSI على إطار الساعة عند 36.3 يشير إلى زخم هابط. أريد أن أرى مستوى إبطال الصفقة عند الحد الأعلى للدخول 1675.70803 يصمد، حتى تتجه صفقة البيع على المكشوف نحو الهدف الأول قرب 1640.83921. أقوى إشارة هي اتجاه الساعة مع تراص المتوسطات الهابط، أما الخطر الرئيسي فهو أن السعر يقل 3.1 ATR عن EMA50، ما يعني أن الارتداد مرجح.
هل أنت مرتاح للبيع على المكشوف عند هذا المستوى، أم ستنتظر حتى يستعيد السعر الحد الأدنى للدخول عند 1670.63197؟
الرسم البياني مع جميع المستويات أدناه.
📲 هل تريد المزيد من أحدث إشاراتي؟ انضم إليّ هنا:
https://app.binance.com/uni-qr/D26WbL9t
⚠️ تحليل شخصي للسوق فقط. NFA — أدر المخاطر بنفسك وأجرِ أبحاثك الخاصة.
محتوى تعليمي، وليس نصيحة استثمارية أو توصية بشراء أي أصل أو بيعه أو إيداعه أو سحبه. لا توجد عروض ترويجية مدفوعة أو روابط إحالة/عمولة.
🔴 بيع على المكشوف $SNDK /USDT: توقع انخفاض السعر
الاتجاه: بيع على المكشوف · قوي
الدخول: 1670.63197 – 1675.70803
الهدف 1: 1640.83921 (-1.9%)
الهدف 2: 1619.28535 (-3.2%)
الهدف 3: 1586.95456 (-5.2%)
وقف الخسارة: 1716.27772 (+2.6%)
الخطة: ادخل فقط ضمن النطاق، وخذ نصف الكمية عند الهدف 1، ثم انقل وقف الخسارة إلى سعر الدخول.
لماذا البيع على المكشوف؟ إشارة قوية، 6/11 من الإشارات تؤيدها، وإشارة واحدة تعارضها، و4 غير حاسمة.
• اتجاه الساعة: السعر < EMA50 < EMA200، وتراص هابط → الاتجاه قصير الأجل هابط
• قوة الاتجاه (ADX/DI، 15 دقيقة): ADX عند 29.9 مع سيطرة البائعين (DI+ 10.8 مقابل DI− 27.2) → البائعون يقودون الحركة
• مؤشر RSI لأربع ساعات: 42.2، زخم هابط (دون 45) → الزخم في صالح البائعين
المخاطر: المسافة عن EMA50 على إطار الساعة: −3.1 ATR من EMA50 للساعة، والسعر مفرط في الابتعاد مع احتمال الارتداد → هبط السعر كثيرًا دون متوسطه، لذا يُرجح حدوث ارتداد
قراءتي لـ SNDK اليوم
أراقب SNDK لأن السعر على إطار الساعة يقع دون EMA50 وEMA200، كما أن RSI على إطار الساعة عند 36.3 يشير إلى زخم هابط. أريد أن أرى مستوى إبطال الصفقة عند الحد الأعلى للدخول 1675.70803 يصمد، حتى تتجه صفقة البيع على المكشوف نحو الهدف الأول قرب 1640.83921. أقوى إشارة هي اتجاه الساعة مع تراص المتوسطات الهابط، أما الخطر الرئيسي فهو أن السعر يقل 3.1 ATR عن EMA50، ما يعني أن الارتداد مرجح.
هل أنت مرتاح للبيع على المكشوف عند هذا المستوى، أم ستنتظر حتى يستعيد السعر الحد الأدنى للدخول عند 1670.63197؟
الرسم البياني مع جميع المستويات أدناه.
📲 هل تريد المزيد من أحدث إشاراتي؟ انضم إليّ هنا:
https://app.binance.com/uni-qr/D26WbL9t
⚠️ تحليل شخصي للسوق فقط. NFA — أدر المخاطر بنفسك وأجرِ أبحاثك الخاصة.
محتوى تعليمي، وليس نصيحة استثمارية أو توصية بشراء أي أصل أو بيعه أو إيداعه أو سحبه. لا توجد عروض ترويجية مدفوعة أو روابط إحالة/عمولة.
1
488
·
--
هابط
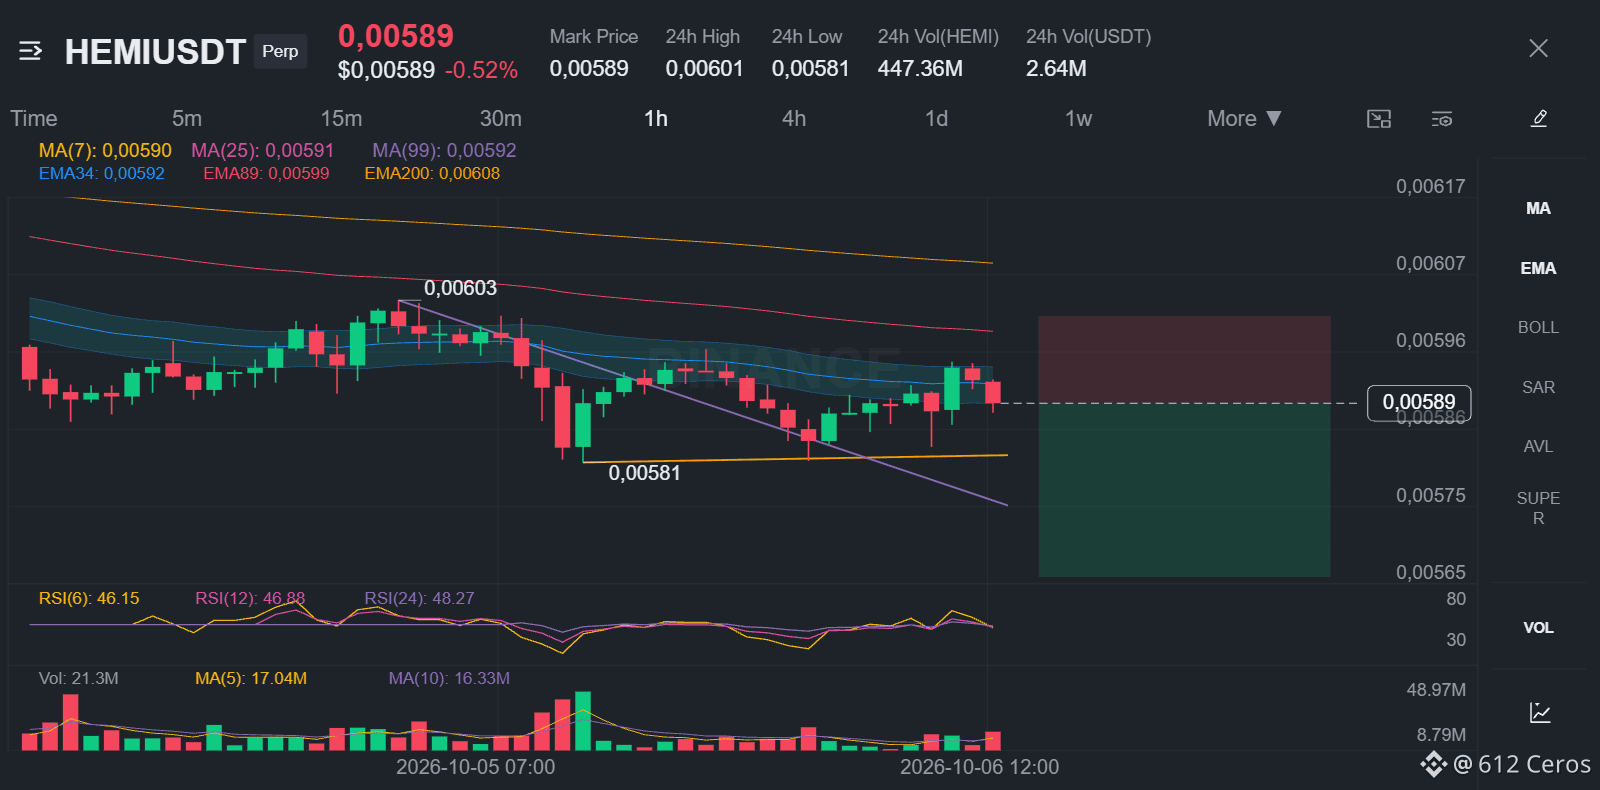
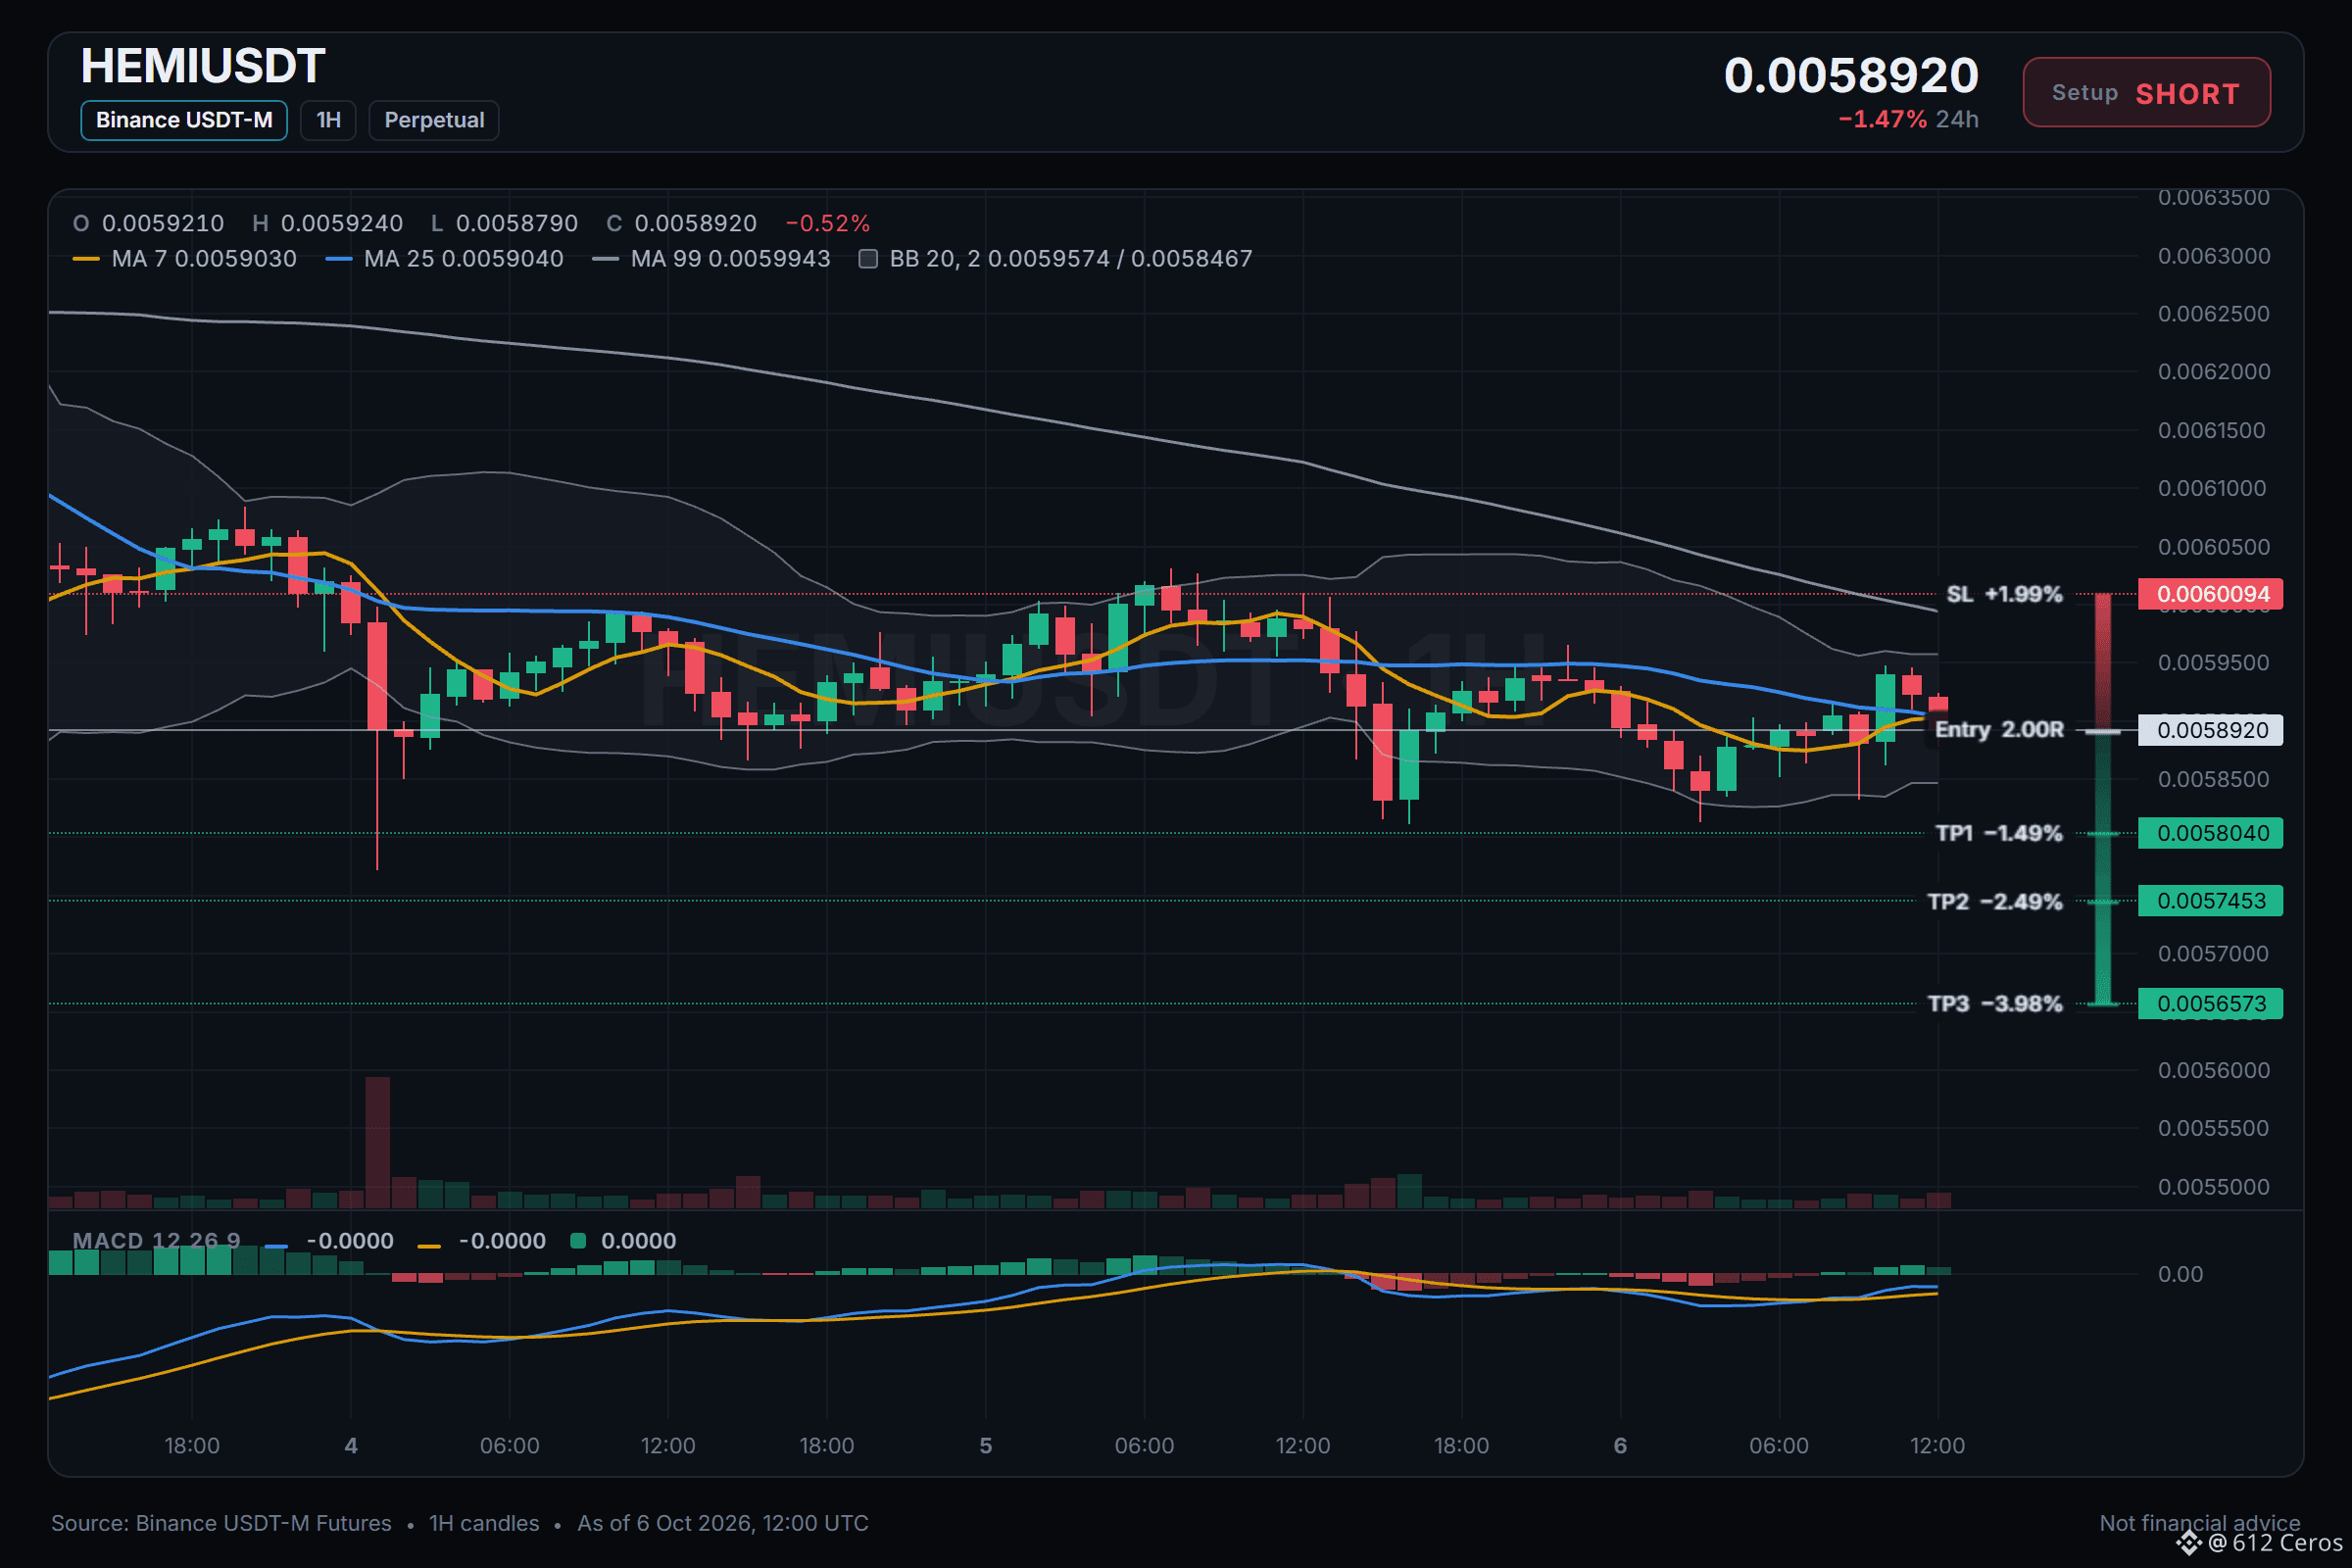
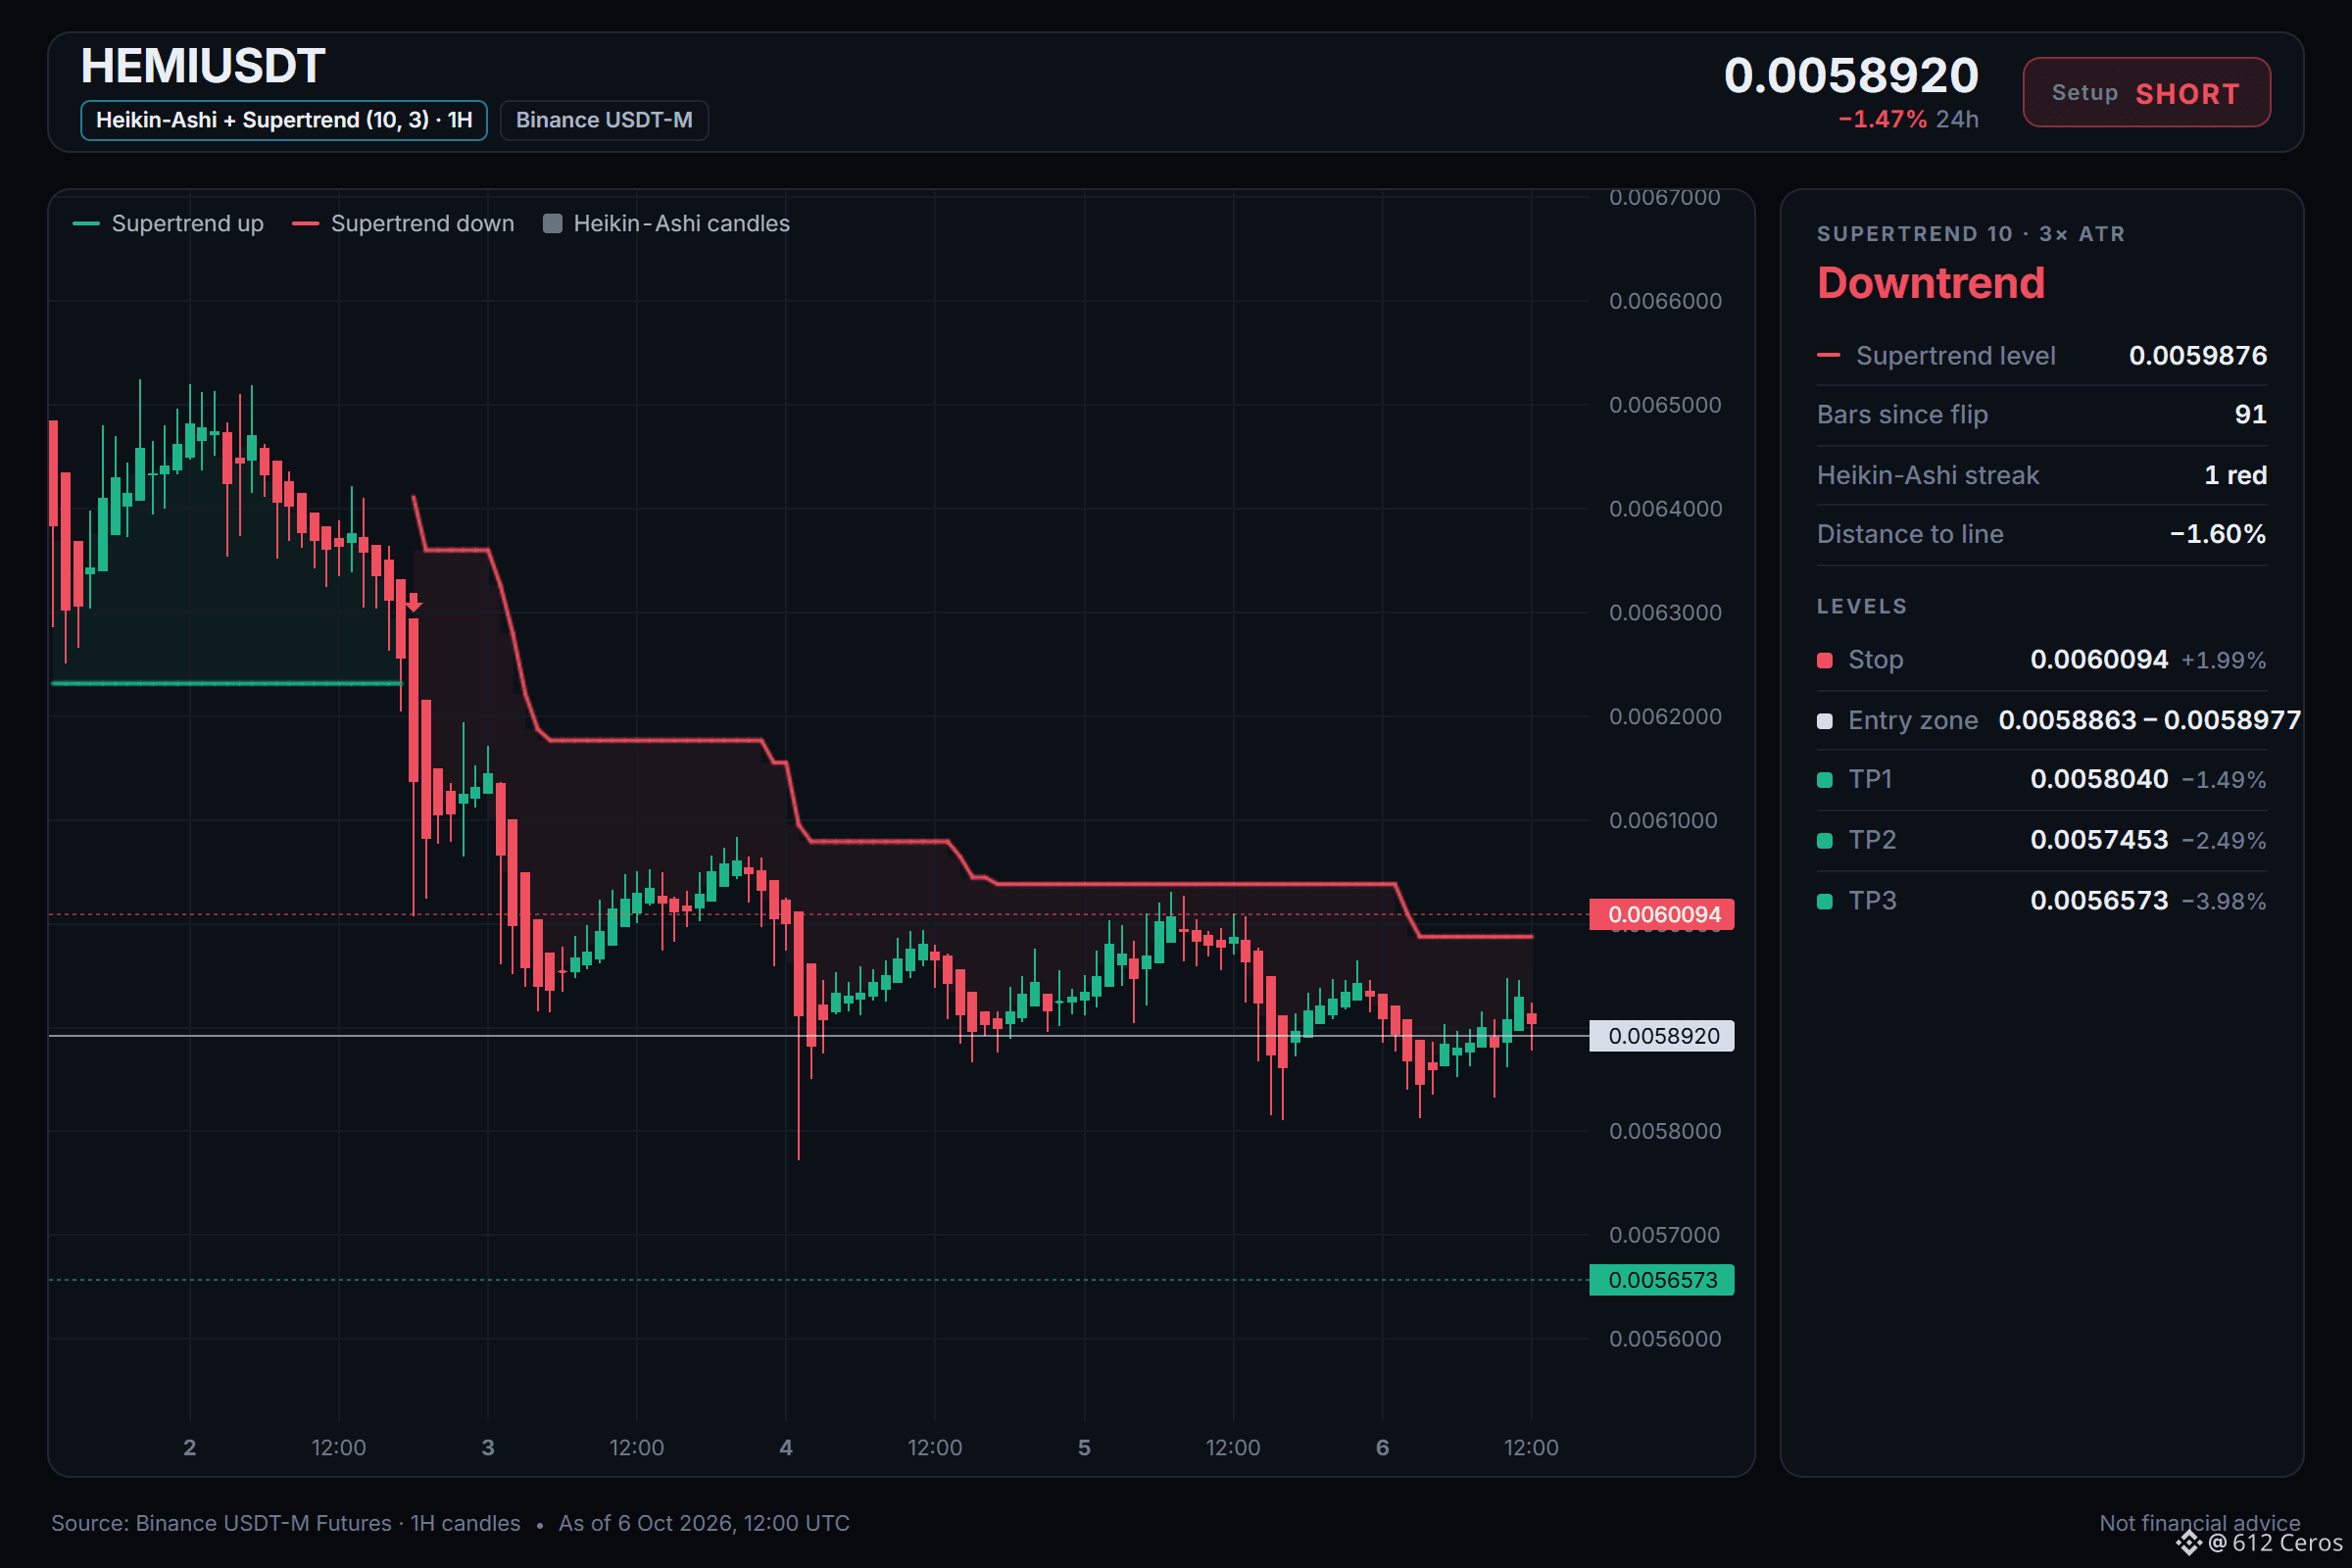
يظل HEMI هابطًا عبر جميع أطر الاتجاه
🔴 بيع على المكشوف $HEMI /USDT: نتوقع هبوط السعر
الميل: بيع على المكشوف · ترجيح
الدخول: 0.0058863 – 0.0058977
جني الربح 1: 0.0058040 (-1.5%)
جني الربح 2: 0.0057453 (-2.5%)
جني الربح 3: 0.0056573 (-4.0%)
وقف الخسارة: 0.0060094 (+2.0%)
الخطة: ادخل فقط ضمن النطاق، وخذ نصف الكمية عند جني الربح 1، ثم حرّك وقف الخسارة إلى نقطة الدخول.
ملاحظة: درجة الاقتناع متوسطة فقط، لذا أبقِ حجم الصفقة صغيرًا.
لماذا البيع على المكشوف؟ إشارة مرجّحة؛ 5/12 من المؤشرات متوافقة، و0 معارضة، و7 غير حاسمة.
• الاتجاه اليومي: السعر < EMA50 < EMA200، تتابع هابط → الاتجاه العام هابط
• اتجاه 4 ساعات: السعر < EMA50 < EMA200، تتابع هابط → اتجاه التأرجح هابط
• اتجاه ساعة واحدة: السعر < EMA50 < EMA200، تتابع هابط → الاتجاه قصير الأجل هابط
س: لماذا البيع على المكشوف مع أن مؤشر RSI على إطار الساعة محايد؟
ج: يبلغ RSI على إطار الساعة 46.6، ما يعني أن الزخم غير محسوم ولا يؤكد انعكاس الاتجاه.
س: متى تكون صفقة البيع على المكشوف هذه خاطئة؟
ج: إذا استعاد السعر مستوى EMA50 على إطار الساعة، تُلغى فكرة البيع على المكشوف، لأن ذلك يعني كسر الاتجاه الهابط الفوري.
ما المستوى الذي يجعلك تعترض على إعداد البيع على المكشوف هذا؟
المستويات موضّحة على الرسم البياني أدناه.
{future}(HEMIUSDT)
📲 أتريد المزيد من أحدث إشاراتي؟ انضم إليّ من هنا:
[https://app.binance.com/uni-qr/D26WbL9t](https://app.binance.com/uni-qr/D26WbL9t)
⚠️ هذا تحليل شخصي للسوق فقط. ليس نصيحة مالية — أدر المخاطر وأجرِ بحثك الخاص.
محتوى تعليمي، وليس نصيحة استثمارية أو توصية بشراء أي أصل أو بيعه أو إيداعه أو سحبه. لا توجد ترويجات مدفوعة أو روابط إحالة/تسويق بالعمولة.
يظل HEMI هابطًا عبر جميع أطر الاتجاه
🔴 بيع على المكشوف $HEMI /USDT: نتوقع هبوط السعر
الميل: بيع على المكشوف · ترجيح
الدخول: 0.0058863 – 0.0058977
جني الربح 1: 0.0058040 (-1.5%)
جني الربح 2: 0.0057453 (-2.5%)
جني الربح 3: 0.0056573 (-4.0%)
وقف الخسارة: 0.0060094 (+2.0%)
الخطة: ادخل فقط ضمن النطاق، وخذ نصف الكمية عند جني الربح 1، ثم حرّك وقف الخسارة إلى نقطة الدخول.
ملاحظة: درجة الاقتناع متوسطة فقط، لذا أبقِ حجم الصفقة صغيرًا.
لماذا البيع على المكشوف؟ إشارة مرجّحة؛ 5/12 من المؤشرات متوافقة، و0 معارضة، و7 غير حاسمة.
• الاتجاه اليومي: السعر < EMA50 < EMA200، تتابع هابط → الاتجاه العام هابط
• اتجاه 4 ساعات: السعر < EMA50 < EMA200، تتابع هابط → اتجاه التأرجح هابط
• اتجاه ساعة واحدة: السعر < EMA50 < EMA200، تتابع هابط → الاتجاه قصير الأجل هابط
س: لماذا البيع على المكشوف مع أن مؤشر RSI على إطار الساعة محايد؟
ج: يبلغ RSI على إطار الساعة 46.6، ما يعني أن الزخم غير محسوم ولا يؤكد انعكاس الاتجاه.
س: متى تكون صفقة البيع على المكشوف هذه خاطئة؟
ج: إذا استعاد السعر مستوى EMA50 على إطار الساعة، تُلغى فكرة البيع على المكشوف، لأن ذلك يعني كسر الاتجاه الهابط الفوري.
ما المستوى الذي يجعلك تعترض على إعداد البيع على المكشوف هذا؟
المستويات موضّحة على الرسم البياني أدناه.
📲 أتريد المزيد من أحدث إشاراتي؟ انضم إليّ من هنا:
https://app.binance.com/uni-qr/D26WbL9t
⚠️ هذا تحليل شخصي للسوق فقط. ليس نصيحة مالية — أدر المخاطر وأجرِ بحثك الخاص.
محتوى تعليمي، وليس نصيحة استثمارية أو توصية بشراء أي أصل أو بيعه أو إيداعه أو سحبه. لا توجد ترويجات مدفوعة أو روابط إحالة/تسويق بالعمولة.
🔴 بيع على المكشوف $HEMI /USDT: نتوقع هبوط السعر
الميل: بيع على المكشوف · ترجيح
الدخول: 0.0058863 – 0.0058977
جني الربح 1: 0.0058040 (-1.5%)
جني الربح 2: 0.0057453 (-2.5%)
جني الربح 3: 0.0056573 (-4.0%)
وقف الخسارة: 0.0060094 (+2.0%)
الخطة: ادخل فقط ضمن النطاق، وخذ نصف الكمية عند جني الربح 1، ثم حرّك وقف الخسارة إلى نقطة الدخول.
ملاحظة: درجة الاقتناع متوسطة فقط، لذا أبقِ حجم الصفقة صغيرًا.
لماذا البيع على المكشوف؟ إشارة مرجّحة؛ 5/12 من المؤشرات متوافقة، و0 معارضة، و7 غير حاسمة.
• الاتجاه اليومي: السعر < EMA50 < EMA200، تتابع هابط → الاتجاه العام هابط
• اتجاه 4 ساعات: السعر < EMA50 < EMA200، تتابع هابط → اتجاه التأرجح هابط
• اتجاه ساعة واحدة: السعر < EMA50 < EMA200، تتابع هابط → الاتجاه قصير الأجل هابط
س: لماذا البيع على المكشوف مع أن مؤشر RSI على إطار الساعة محايد؟
ج: يبلغ RSI على إطار الساعة 46.6، ما يعني أن الزخم غير محسوم ولا يؤكد انعكاس الاتجاه.
س: متى تكون صفقة البيع على المكشوف هذه خاطئة؟
ج: إذا استعاد السعر مستوى EMA50 على إطار الساعة، تُلغى فكرة البيع على المكشوف، لأن ذلك يعني كسر الاتجاه الهابط الفوري.
ما المستوى الذي يجعلك تعترض على إعداد البيع على المكشوف هذا؟
المستويات موضّحة على الرسم البياني أدناه.
📲 أتريد المزيد من أحدث إشاراتي؟ انضم إليّ من هنا:
https://app.binance.com/uni-qr/D26WbL9t
⚠️ هذا تحليل شخصي للسوق فقط. ليس نصيحة مالية — أدر المخاطر وأجرِ بحثك الخاص.
محتوى تعليمي، وليس نصيحة استثمارية أو توصية بشراء أي أصل أو بيعه أو إيداعه أو سحبه. لا توجد ترويجات مدفوعة أو روابط إحالة/تسويق بالعمولة.
1
723
·
--
صاعد
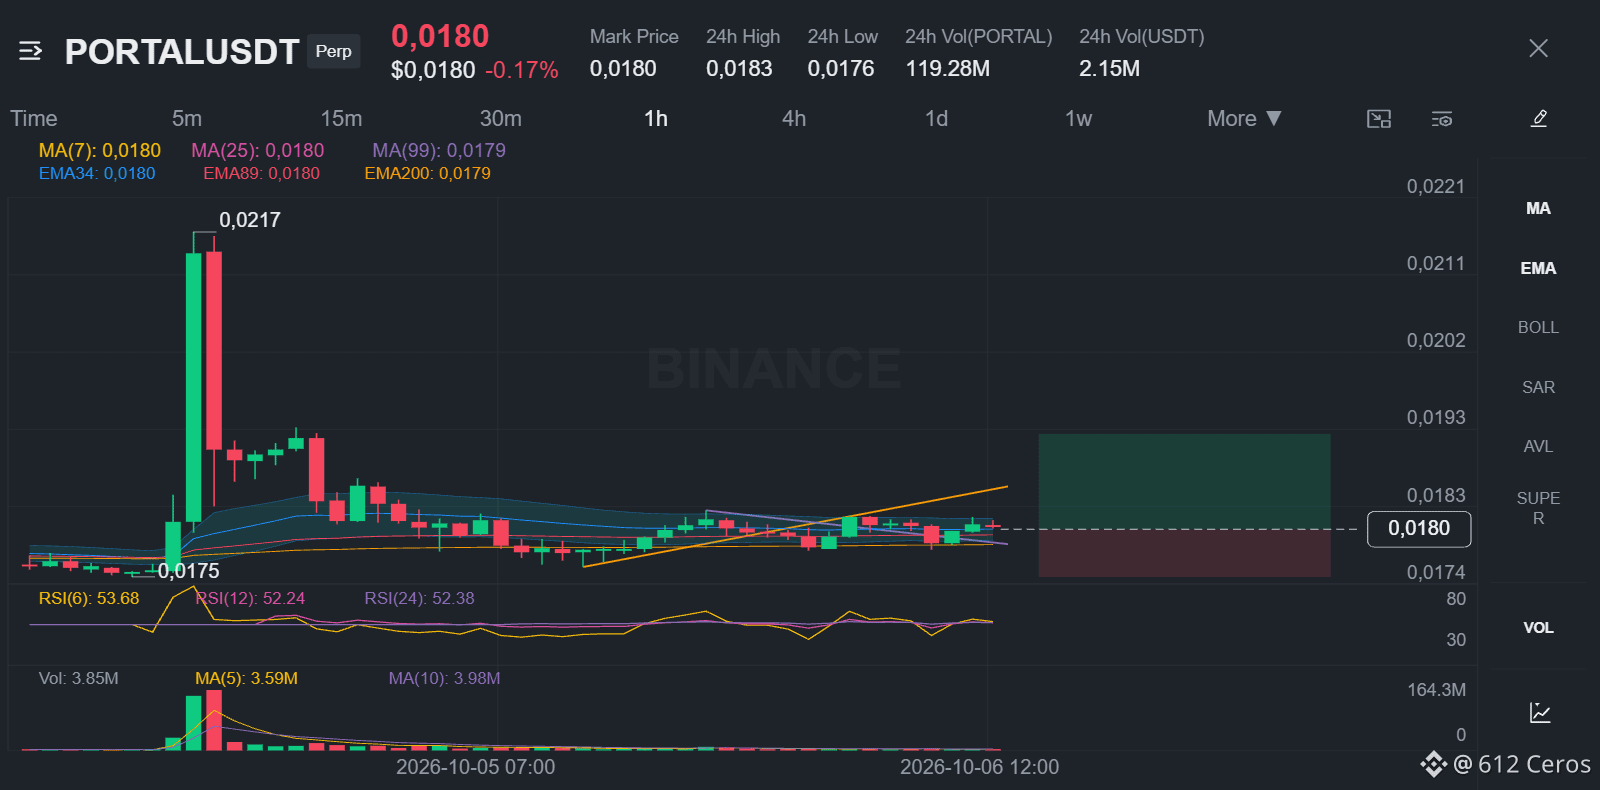
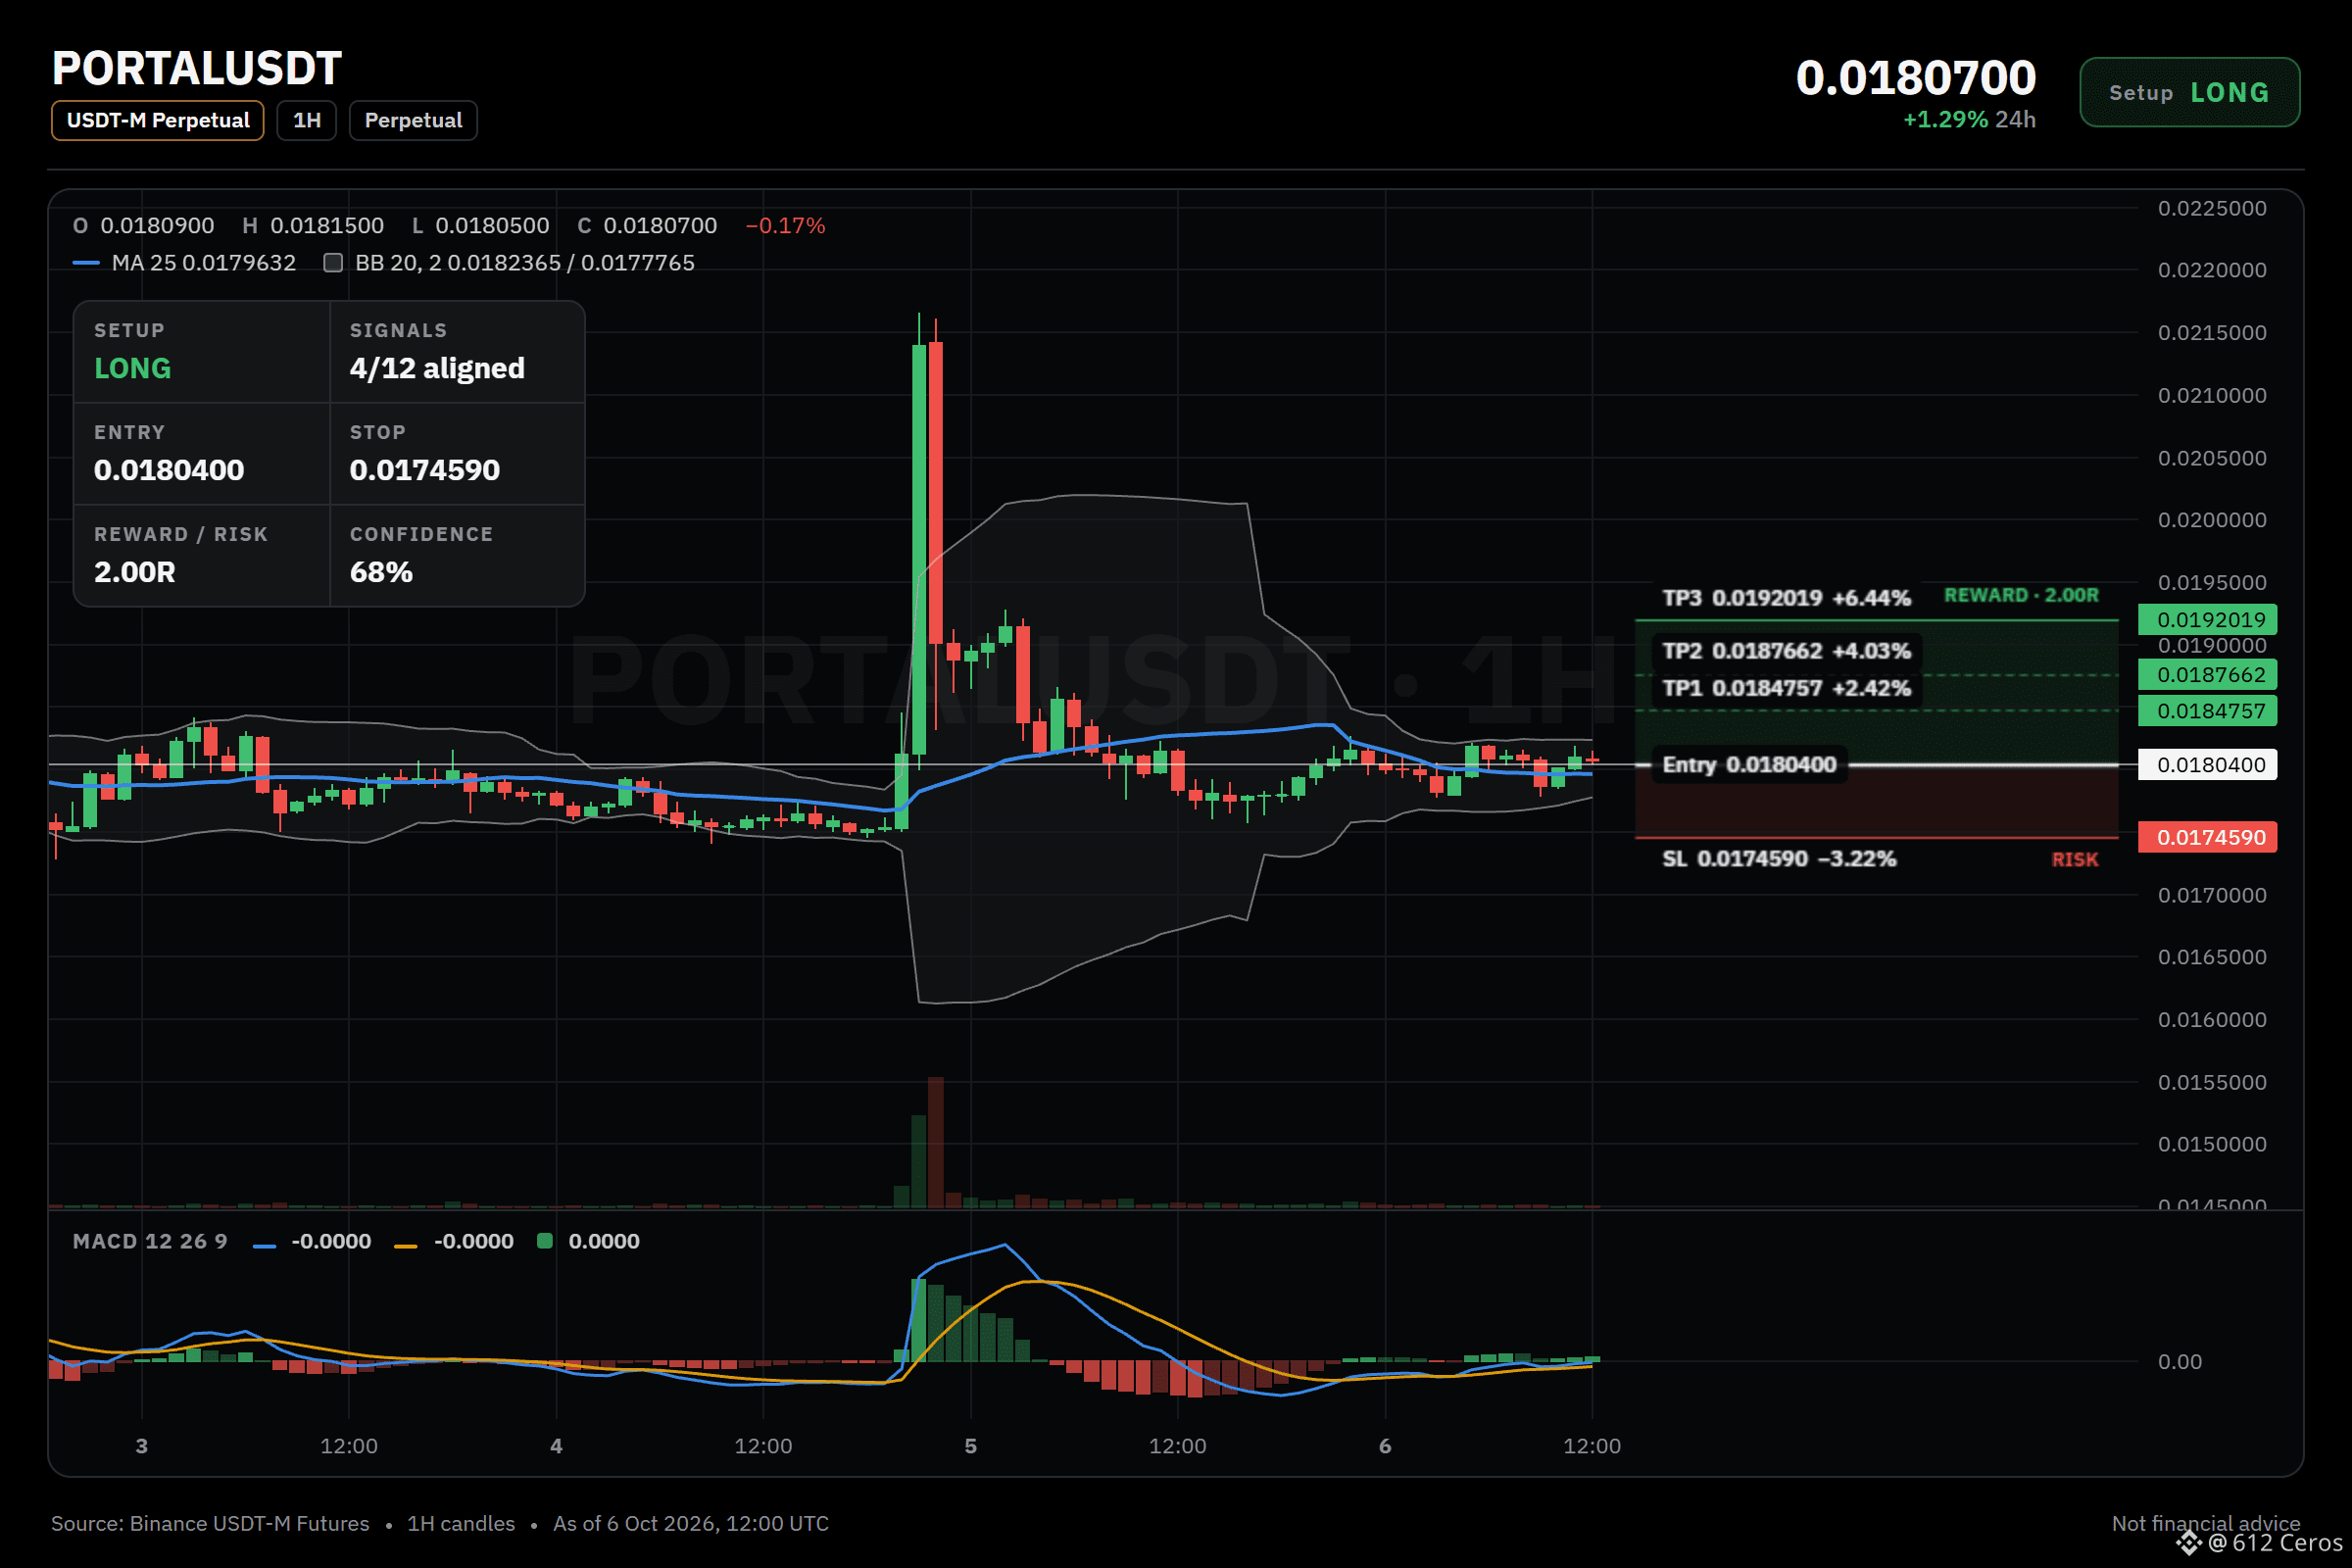
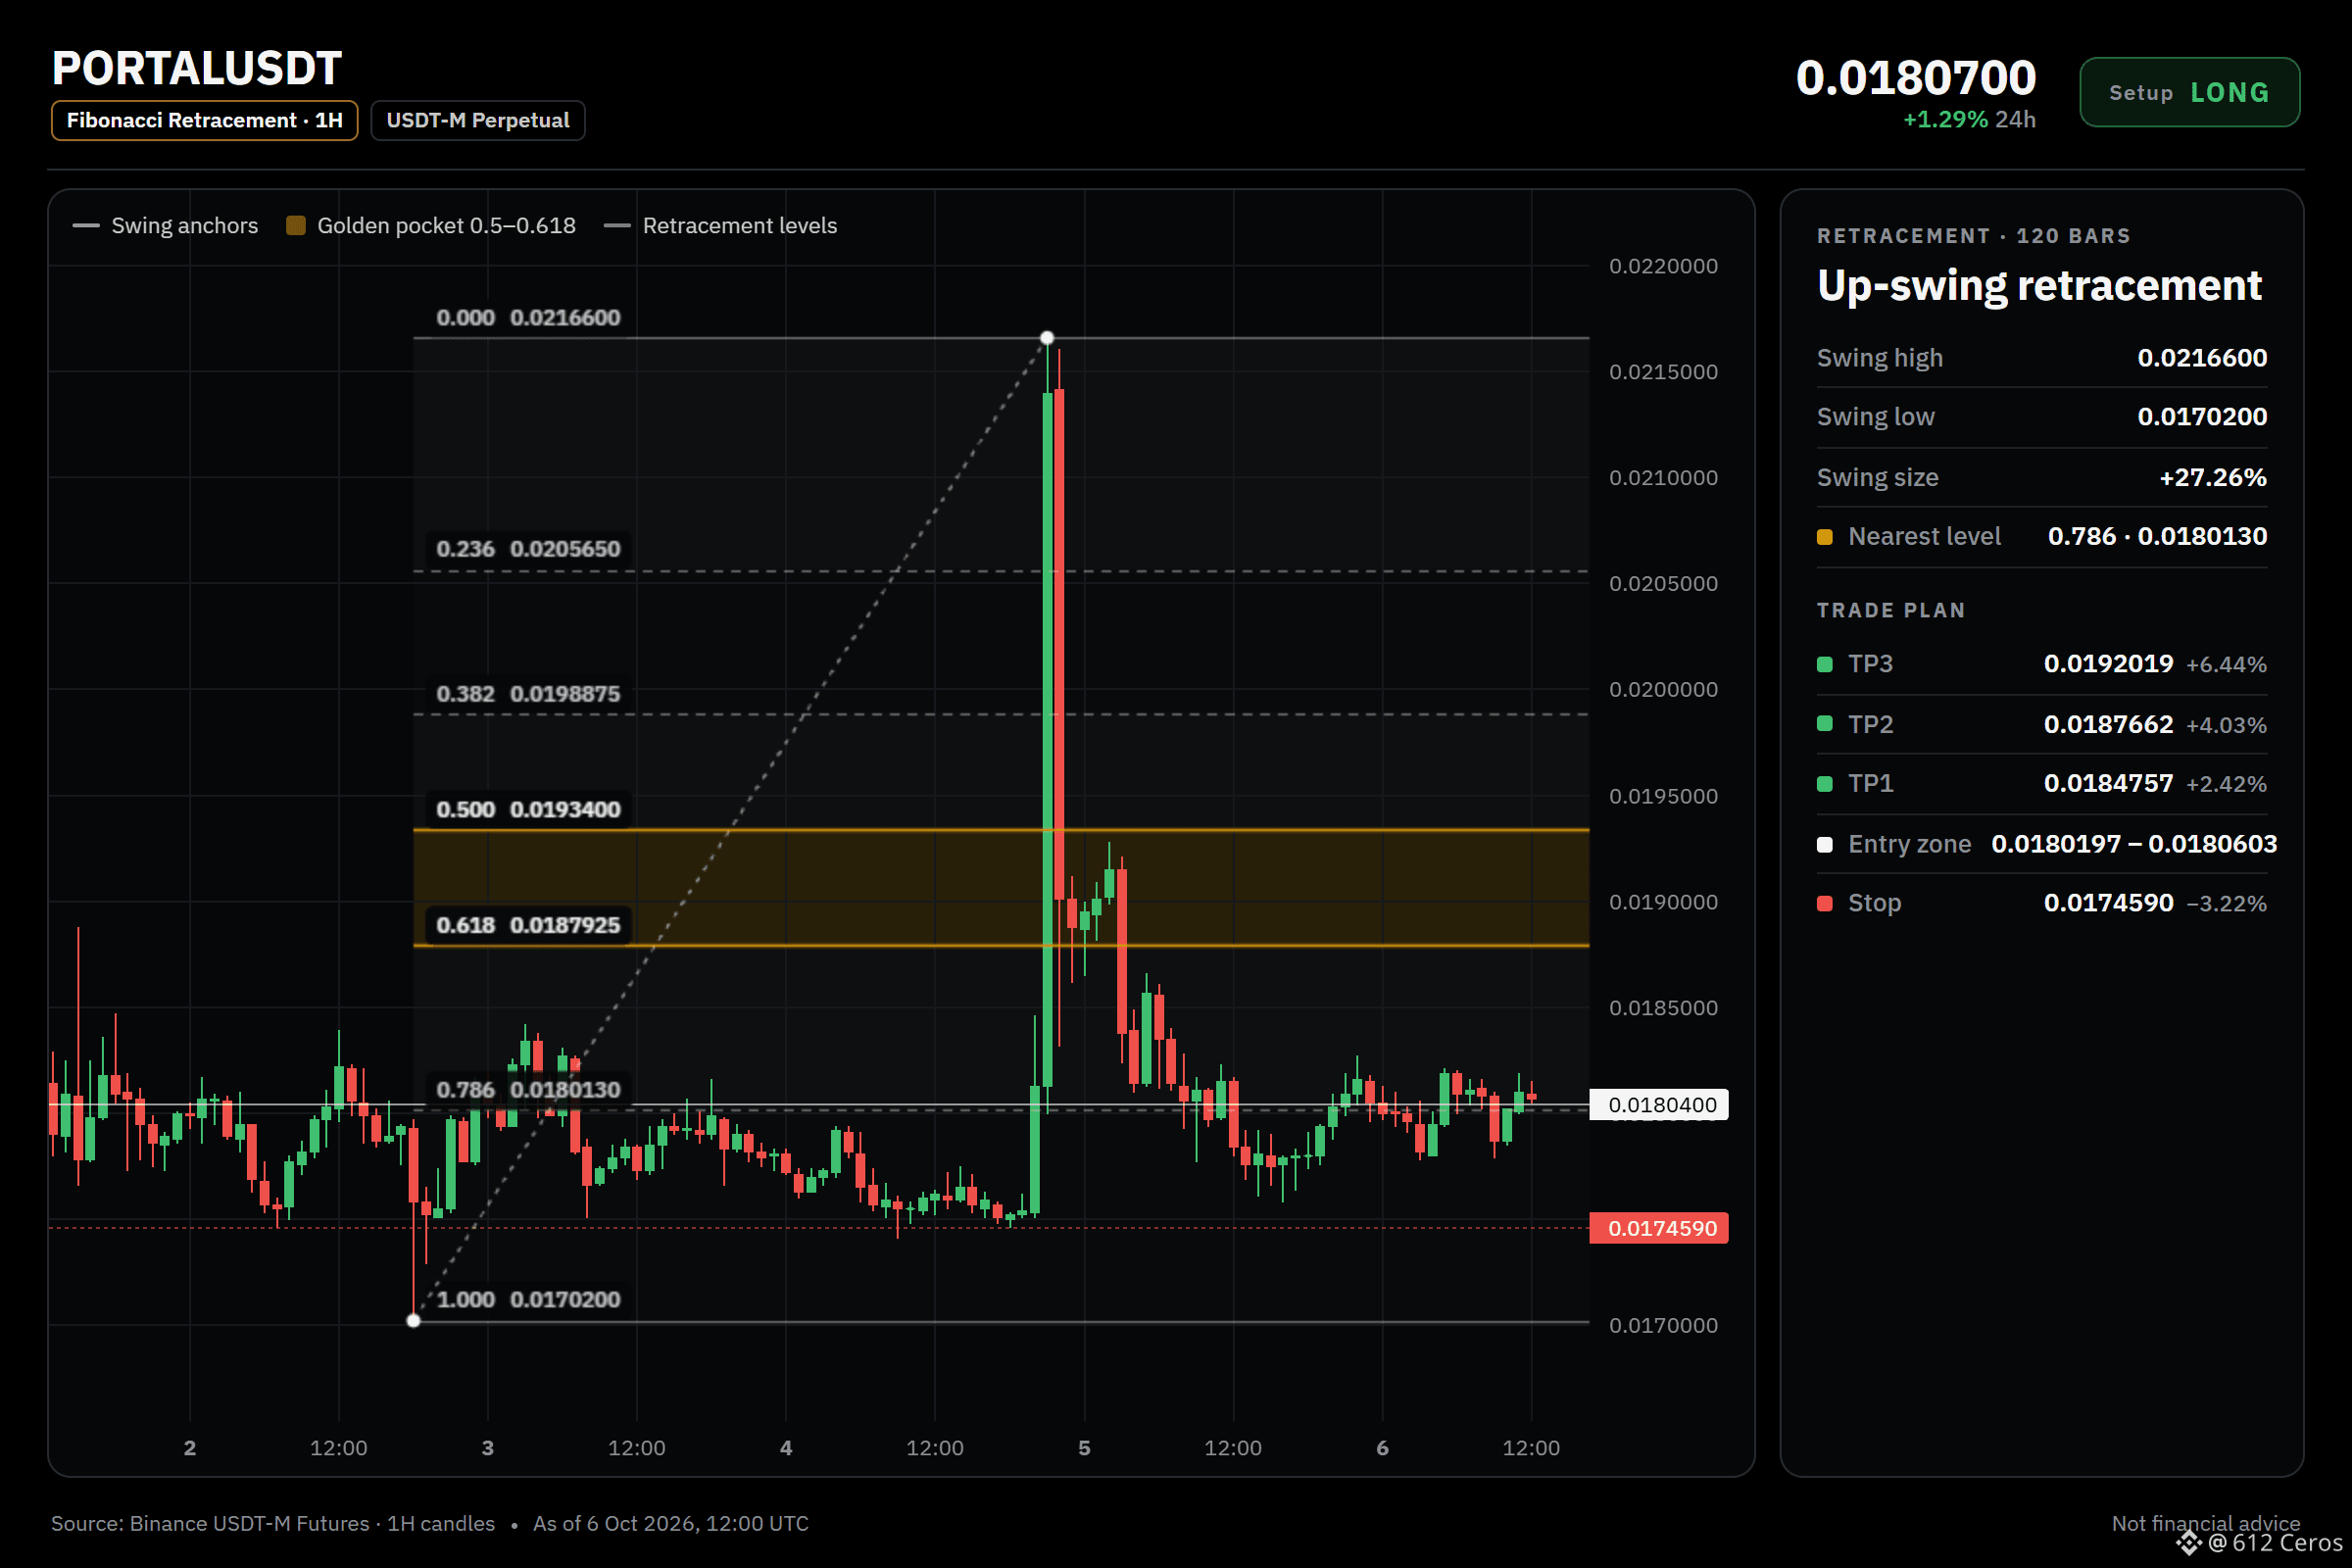
إعداد صفقة شراء PORTAL: المستويات التي أراقبها
🟢 شراء $PORTAL /USDT: أتوقع ارتفاع السعر
التوجّه: شراء · ميل إيجابي
الدخول: 0.0180197 – 0.0180603
الهدف 1: 0.0184757 (+2.4%)
الهدف 2: 0.0187662 (+4.0%)
الهدف 3: 0.0192019 (+6.4%)
وقف الخسارة: 0.0174590 (-3.2%)
الخطة: ادخل فقط ضمن النطاق، وخذ نصف الكمية عند الهدف الأول، ثم حرّك وقف الخسارة إلى سعر الدخول.
ملاحظة: الثقة متوسطة فقط، لذا اجعل حجم الصفقة صغيرًا.
لماذا الشراء؟ التوجّه يميل للشراء؛ 4 من أصل 12 إشارة تؤيده، ولا توجد إشارات معاكسة، بينما 8 إشارات غير حاسمة.
• الاتجاه اليومي: السعر > EMA50 > EMA200، ترتيب صعودي ← الاتجاه العام صاعد
• اتجاه 4 ساعات: السعر > EMA50 > EMA200، ترتيب صعودي ← اتجاه التذبذب صاعد
• اتجاه ساعة واحدة: السعر > EMA50 > EMA200، ترتيب صعودي ← الاتجاه قصير الأجل صاعد
ببساطة:
الاتجاه اليومي يبدو صعوديًا، و4 من أصل 12 إشارة متوافقة ترجّح الشراء. الخطة هي التداول ضمن نطاق 0.0180197 – 0.0180603، وجني جزء من الأرباح عند 0.0184757 و0.0187662، والتحلي بالصبر للوصول إلى 0.0192019. اختراق مستوى 0.0174590 يعني أن الفكرة لم تعد صالحة، وعندها يؤدي وقف الخسارة دوره.
هل يصل PORTAL إلى 0.0184757 أولًا، أم يُفعّل وقف الخسارة؟
المستويات محددة على الرسم البياني أدناه.
{future}(PORTALUSDT)
📲 هل تريد المزيد من أحدث إشاراتي؟ انضم إليّ من هنا:
[https://app.binance.com/uni-qr/D26WbL9t](https://app.binance.com/uni-qr/D26WbL9t)
⚠️ هذا تحليل شخصي للسوق فقط. ليس نصيحة مالية — أدر المخاطر بنفسك وأجرِ بحثك الخاص.
محتوى تعليمي، وليس نصيحة استثمارية أو توصية بشراء أي أصل أو بيعه أو إيداعه أو سحبه. لا توجد عروض ترويجية مدفوعة أو روابط إحالة/تسويق بالعمولة.
إعداد صفقة شراء PORTAL: المستويات التي أراقبها
🟢 شراء $PORTAL /USDT: أتوقع ارتفاع السعر
التوجّه: شراء · ميل إيجابي
الدخول: 0.0180197 – 0.0180603
الهدف 1: 0.0184757 (+2.4%)
الهدف 2: 0.0187662 (+4.0%)
الهدف 3: 0.0192019 (+6.4%)
وقف الخسارة: 0.0174590 (-3.2%)
الخطة: ادخل فقط ضمن النطاق، وخذ نصف الكمية عند الهدف الأول، ثم حرّك وقف الخسارة إلى سعر الدخول.
ملاحظة: الثقة متوسطة فقط، لذا اجعل حجم الصفقة صغيرًا.
لماذا الشراء؟ التوجّه يميل للشراء؛ 4 من أصل 12 إشارة تؤيده، ولا توجد إشارات معاكسة، بينما 8 إشارات غير حاسمة.
• الاتجاه اليومي: السعر > EMA50 > EMA200، ترتيب صعودي ← الاتجاه العام صاعد
• اتجاه 4 ساعات: السعر > EMA50 > EMA200، ترتيب صعودي ← اتجاه التذبذب صاعد
• اتجاه ساعة واحدة: السعر > EMA50 > EMA200، ترتيب صعودي ← الاتجاه قصير الأجل صاعد
ببساطة:
الاتجاه اليومي يبدو صعوديًا، و4 من أصل 12 إشارة متوافقة ترجّح الشراء. الخطة هي التداول ضمن نطاق 0.0180197 – 0.0180603، وجني جزء من الأرباح عند 0.0184757 و0.0187662، والتحلي بالصبر للوصول إلى 0.0192019. اختراق مستوى 0.0174590 يعني أن الفكرة لم تعد صالحة، وعندها يؤدي وقف الخسارة دوره.
هل يصل PORTAL إلى 0.0184757 أولًا، أم يُفعّل وقف الخسارة؟
المستويات محددة على الرسم البياني أدناه.
📲 هل تريد المزيد من أحدث إشاراتي؟ انضم إليّ من هنا:
https://app.binance.com/uni-qr/D26WbL9t
⚠️ هذا تحليل شخصي للسوق فقط. ليس نصيحة مالية — أدر المخاطر بنفسك وأجرِ بحثك الخاص.
محتوى تعليمي، وليس نصيحة استثمارية أو توصية بشراء أي أصل أو بيعه أو إيداعه أو سحبه. لا توجد عروض ترويجية مدفوعة أو روابط إحالة/تسويق بالعمولة.
🟢 شراء $PORTAL /USDT: أتوقع ارتفاع السعر
التوجّه: شراء · ميل إيجابي
الدخول: 0.0180197 – 0.0180603
الهدف 1: 0.0184757 (+2.4%)
الهدف 2: 0.0187662 (+4.0%)
الهدف 3: 0.0192019 (+6.4%)
وقف الخسارة: 0.0174590 (-3.2%)
الخطة: ادخل فقط ضمن النطاق، وخذ نصف الكمية عند الهدف الأول، ثم حرّك وقف الخسارة إلى سعر الدخول.
ملاحظة: الثقة متوسطة فقط، لذا اجعل حجم الصفقة صغيرًا.
لماذا الشراء؟ التوجّه يميل للشراء؛ 4 من أصل 12 إشارة تؤيده، ولا توجد إشارات معاكسة، بينما 8 إشارات غير حاسمة.
• الاتجاه اليومي: السعر > EMA50 > EMA200، ترتيب صعودي ← الاتجاه العام صاعد
• اتجاه 4 ساعات: السعر > EMA50 > EMA200، ترتيب صعودي ← اتجاه التذبذب صاعد
• اتجاه ساعة واحدة: السعر > EMA50 > EMA200، ترتيب صعودي ← الاتجاه قصير الأجل صاعد
ببساطة:
الاتجاه اليومي يبدو صعوديًا، و4 من أصل 12 إشارة متوافقة ترجّح الشراء. الخطة هي التداول ضمن نطاق 0.0180197 – 0.0180603، وجني جزء من الأرباح عند 0.0184757 و0.0187662، والتحلي بالصبر للوصول إلى 0.0192019. اختراق مستوى 0.0174590 يعني أن الفكرة لم تعد صالحة، وعندها يؤدي وقف الخسارة دوره.
هل يصل PORTAL إلى 0.0184757 أولًا، أم يُفعّل وقف الخسارة؟
المستويات محددة على الرسم البياني أدناه.
📲 هل تريد المزيد من أحدث إشاراتي؟ انضم إليّ من هنا:
https://app.binance.com/uni-qr/D26WbL9t
⚠️ هذا تحليل شخصي للسوق فقط. ليس نصيحة مالية — أدر المخاطر بنفسك وأجرِ بحثك الخاص.
محتوى تعليمي، وليس نصيحة استثمارية أو توصية بشراء أي أصل أو بيعه أو إيداعه أو سحبه. لا توجد عروض ترويجية مدفوعة أو روابط إحالة/تسويق بالعمولة.
2
554
·
--
صاعد
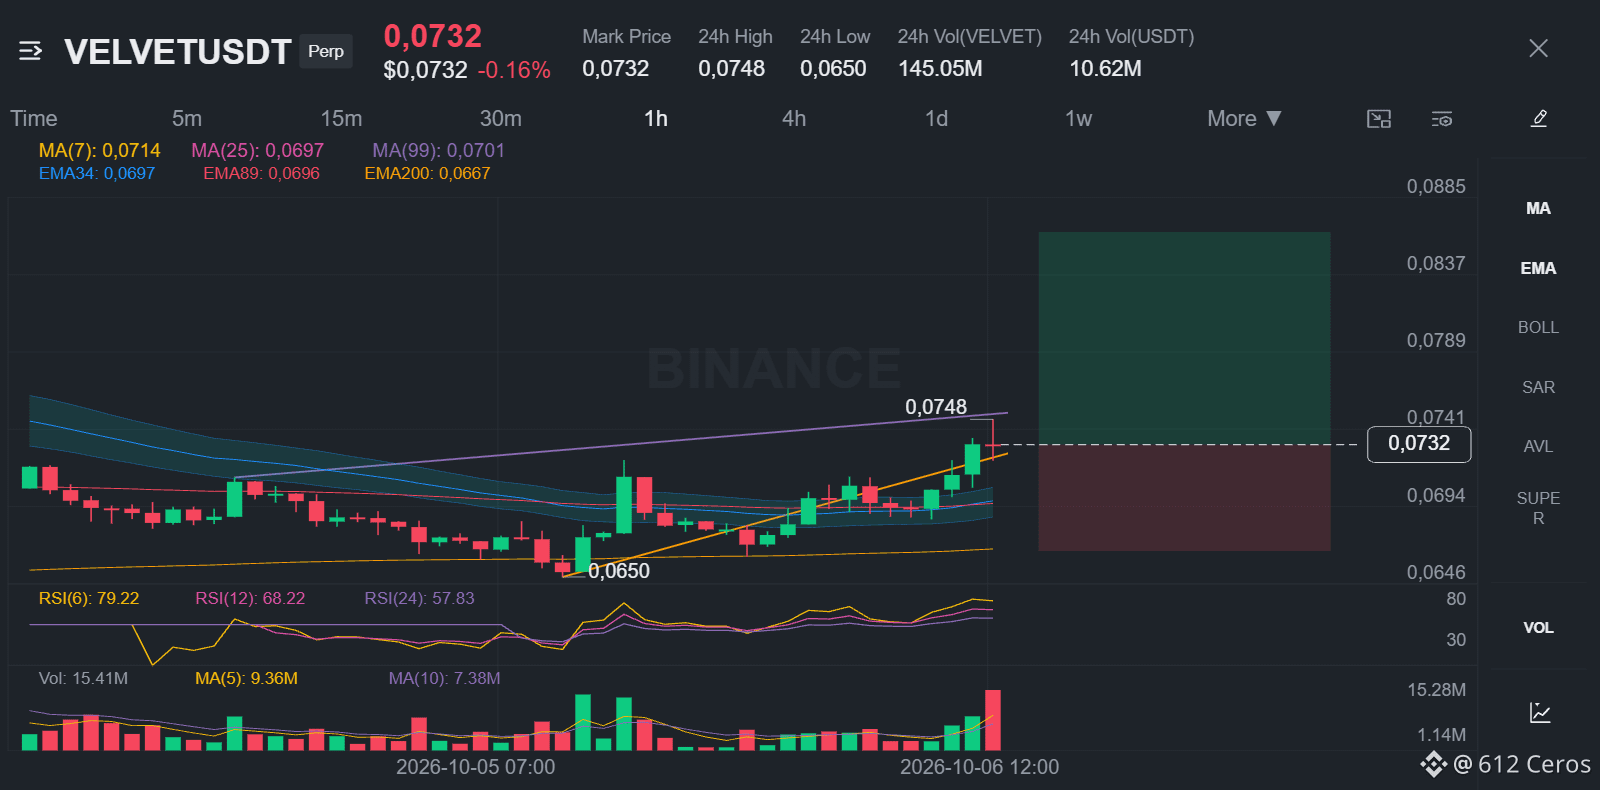
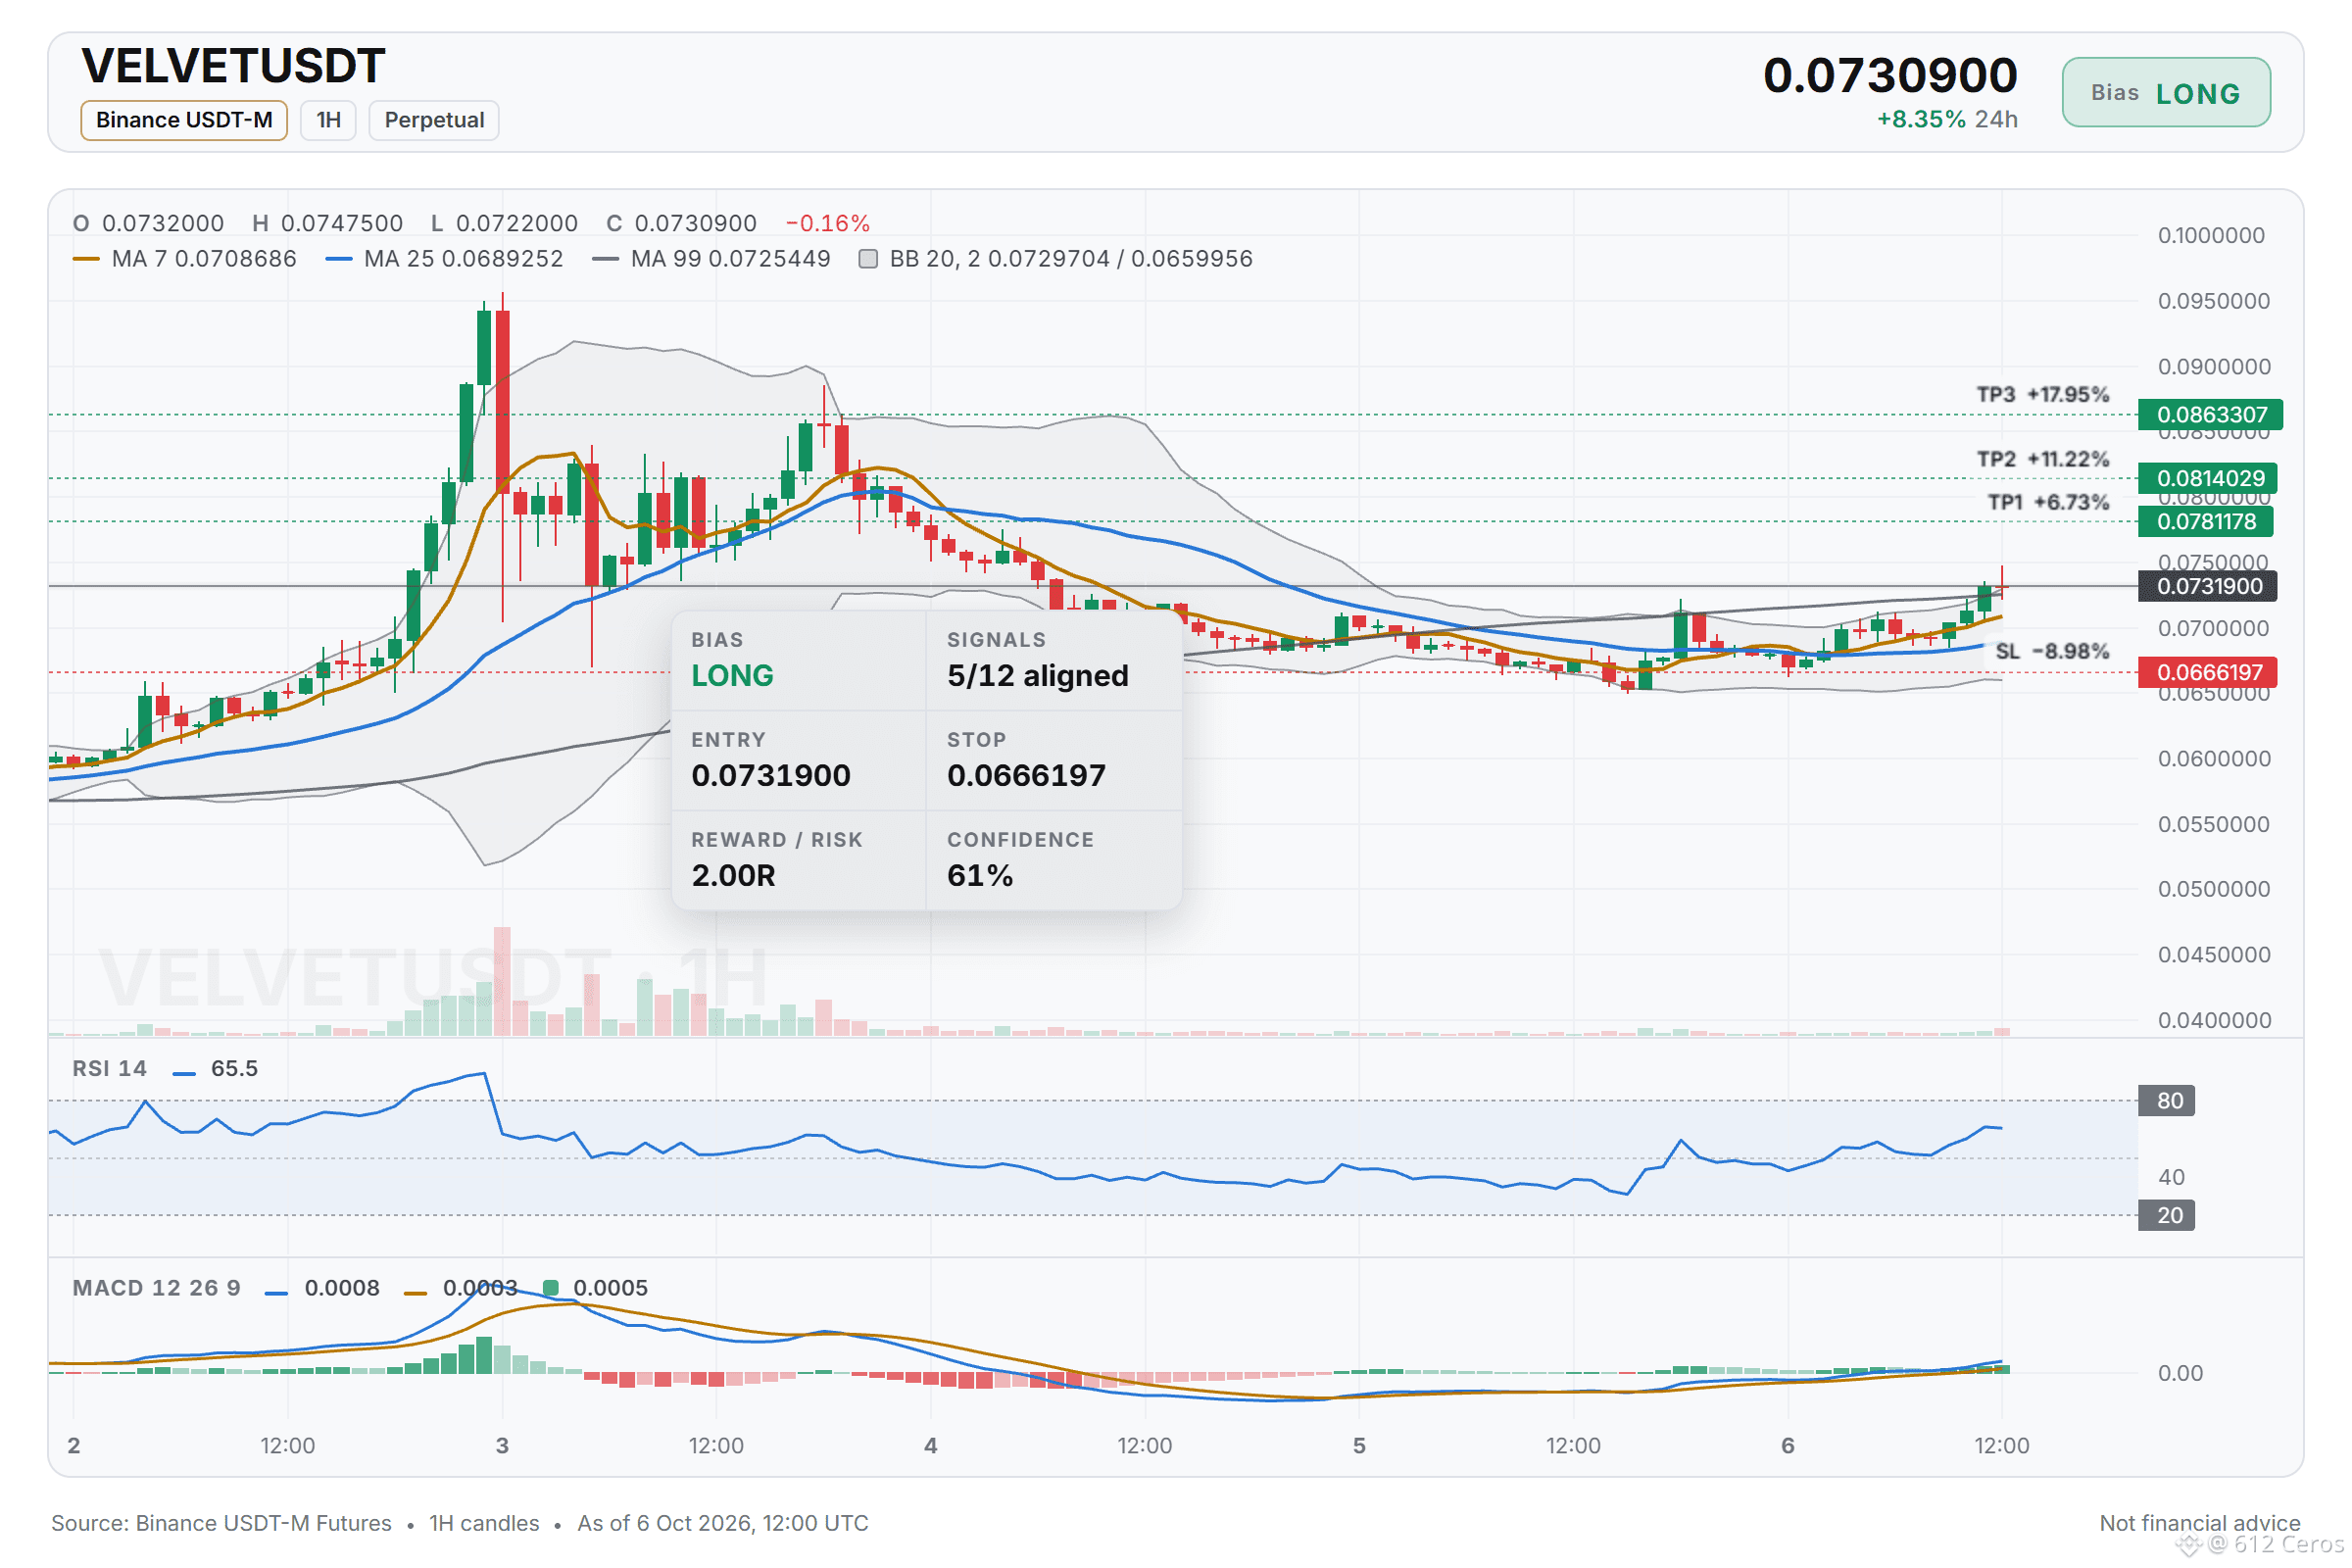
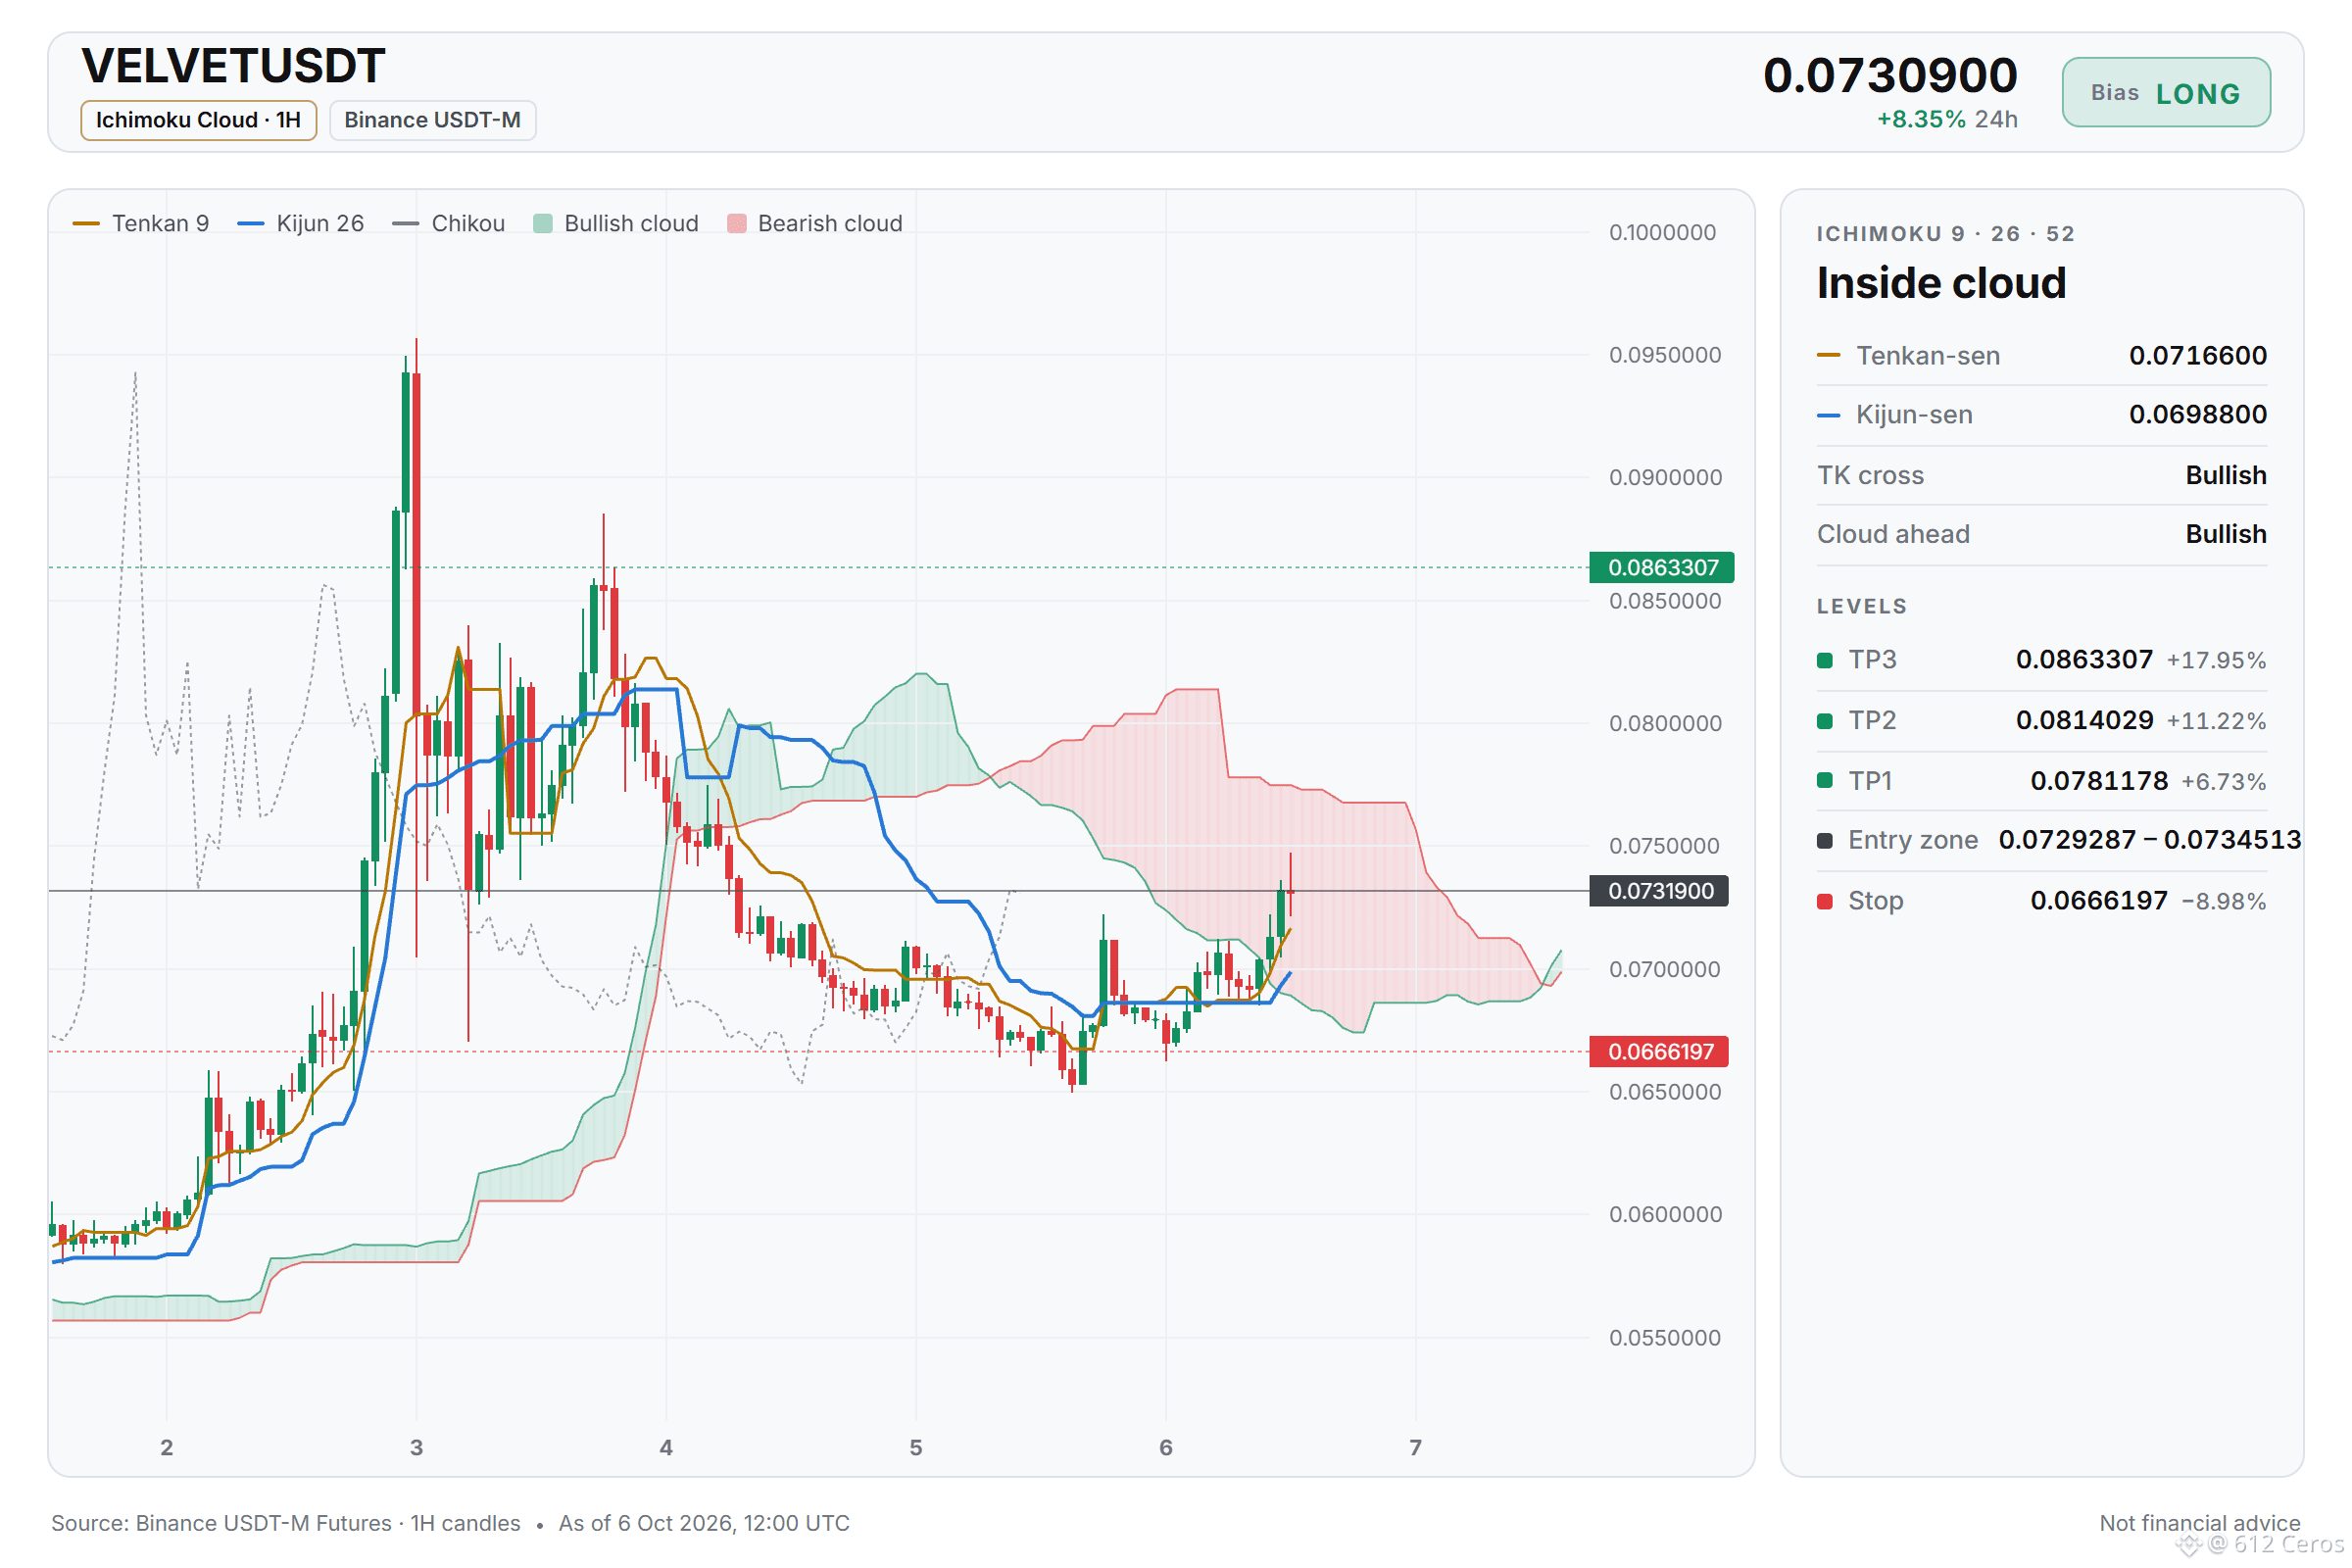
إعداد صفقة شراء VELVET: المستويات التي أراقبها
🟢 شراء $VELVET /USDT: أتوقع أن يرتفع السعر
التوجه: شراء · ميل للصعود
الدخول: 0.0729287 – 0.0734513
الهدف 1: 0.0781178 (+6.7%)
الهدف 2: 0.0814029 (+11.2%)
الهدف 3: 0.0863307 (+18.0%)
وقف الخسارة: 0.0666197 (-9.0%)
الخطة: ادخل فقط ضمن النطاق، وبِع نصف الكمية عند الهدف الأول، ثم انقل وقف الخسارة إلى سعر الدخول.
تنبيه: إعداد عكس الاتجاه العام، ولا تؤكده سوى 5 إشارات. قلّل حجم الصفقة والتزم بوقف الخسارة.
لماذا الشراء؟ التوجه يميل إلى الشراء؛ 5 من أصل 12 إشارة تؤيد ذلك، وإشارة واحدة تعارضه، و6 إشارات غير حاسمة.
• اتجاه الساعة الواحدة: السعر > EMA50 > EMA200، ترتيب صعودي → الاتجاه قصير الأجل صاعد
• قوة الاتجاه (ADX/DI، 15 دقيقة): ADX عند 37.1، والمشترون يسيطرون (DI+ عند 33.3 مقابل DI− عند 14.0) → المشترون يقودون الحركة
• مؤشر RSI لأربع ساعات: 56.3، زخم صعودي (أعلى من 55) → الزخم في صالح المشترين
المخاطر: الاتجاه اليومي: السعر < EMA50 < EMA200، ترتيب هبوطي → الاتجاه العام هابط
لماذا الآن؟
الاتجاه اليومي هبوطي، لكن 5 من أصل 12 إشارة مصطفّة تؤيد الشراء. الخطة هي التداول ضمن نطاق 0.0729287 – 0.0734513، وجني جزء من الأرباح عند 0.0781178 و0.0814029، والتحلي بالصبر انتظارًا للوصول إلى 0.0863307. إذا هبط السعر إلى ما دون 0.0666197، فهذا يعني أن الفكرة لم تعد صالحة، وسيؤدي وقف الخسارة دوره. هذه مراهنة عكس اتجاه الأطر الزمنية الأكبر، لذا قلّل حجم الصفقة.
هل يصل VELVET إلى 0.0781178 أولًا، أم يضرب وقف الخسارة؟
الرسم البياني أدناه يتضمن جميع المستويات.
{future}(VELVETUSDT)
📲 هل تريد المزيد من أحدث إشاراتي؟ انضم إليّ هنا:
[https://app.binance.com/uni-qr/D26WbL9t](https://app.binance.com/uni-qr/D26WbL9t)
⚠️ هذا تحليل شخصي للسوق فقط. لا تُعد هذه نصيحة مالية — أدر المخاطر وأجرِ بحثك بنفسك.
محتوى تعليمي وليس نصيحة استثمارية أو توصية بشراء أي أصل أو بيعه أو إيداعه أو سحبه. لا توجد إعلانات مدفوعة أو روابط إحالة/تسويق بالعمولة.
إعداد صفقة شراء VELVET: المستويات التي أراقبها
🟢 شراء $VELVET /USDT: أتوقع أن يرتفع السعر
التوجه: شراء · ميل للصعود
الدخول: 0.0729287 – 0.0734513
الهدف 1: 0.0781178 (+6.7%)
الهدف 2: 0.0814029 (+11.2%)
الهدف 3: 0.0863307 (+18.0%)
وقف الخسارة: 0.0666197 (-9.0%)
الخطة: ادخل فقط ضمن النطاق، وبِع نصف الكمية عند الهدف الأول، ثم انقل وقف الخسارة إلى سعر الدخول.
تنبيه: إعداد عكس الاتجاه العام، ولا تؤكده سوى 5 إشارات. قلّل حجم الصفقة والتزم بوقف الخسارة.
لماذا الشراء؟ التوجه يميل إلى الشراء؛ 5 من أصل 12 إشارة تؤيد ذلك، وإشارة واحدة تعارضه، و6 إشارات غير حاسمة.
• اتجاه الساعة الواحدة: السعر > EMA50 > EMA200، ترتيب صعودي → الاتجاه قصير الأجل صاعد
• قوة الاتجاه (ADX/DI، 15 دقيقة): ADX عند 37.1، والمشترون يسيطرون (DI+ عند 33.3 مقابل DI− عند 14.0) → المشترون يقودون الحركة
• مؤشر RSI لأربع ساعات: 56.3، زخم صعودي (أعلى من 55) → الزخم في صالح المشترين
المخاطر: الاتجاه اليومي: السعر < EMA50 < EMA200، ترتيب هبوطي → الاتجاه العام هابط
لماذا الآن؟
الاتجاه اليومي هبوطي، لكن 5 من أصل 12 إشارة مصطفّة تؤيد الشراء. الخطة هي التداول ضمن نطاق 0.0729287 – 0.0734513، وجني جزء من الأرباح عند 0.0781178 و0.0814029، والتحلي بالصبر انتظارًا للوصول إلى 0.0863307. إذا هبط السعر إلى ما دون 0.0666197، فهذا يعني أن الفكرة لم تعد صالحة، وسيؤدي وقف الخسارة دوره. هذه مراهنة عكس اتجاه الأطر الزمنية الأكبر، لذا قلّل حجم الصفقة.
هل يصل VELVET إلى 0.0781178 أولًا، أم يضرب وقف الخسارة؟
الرسم البياني أدناه يتضمن جميع المستويات.
📲 هل تريد المزيد من أحدث إشاراتي؟ انضم إليّ هنا:
https://app.binance.com/uni-qr/D26WbL9t
⚠️ هذا تحليل شخصي للسوق فقط. لا تُعد هذه نصيحة مالية — أدر المخاطر وأجرِ بحثك بنفسك.
محتوى تعليمي وليس نصيحة استثمارية أو توصية بشراء أي أصل أو بيعه أو إيداعه أو سحبه. لا توجد إعلانات مدفوعة أو روابط إحالة/تسويق بالعمولة.
🟢 شراء $VELVET /USDT: أتوقع أن يرتفع السعر
التوجه: شراء · ميل للصعود
الدخول: 0.0729287 – 0.0734513
الهدف 1: 0.0781178 (+6.7%)
الهدف 2: 0.0814029 (+11.2%)
الهدف 3: 0.0863307 (+18.0%)
وقف الخسارة: 0.0666197 (-9.0%)
الخطة: ادخل فقط ضمن النطاق، وبِع نصف الكمية عند الهدف الأول، ثم انقل وقف الخسارة إلى سعر الدخول.
تنبيه: إعداد عكس الاتجاه العام، ولا تؤكده سوى 5 إشارات. قلّل حجم الصفقة والتزم بوقف الخسارة.
لماذا الشراء؟ التوجه يميل إلى الشراء؛ 5 من أصل 12 إشارة تؤيد ذلك، وإشارة واحدة تعارضه، و6 إشارات غير حاسمة.
• اتجاه الساعة الواحدة: السعر > EMA50 > EMA200، ترتيب صعودي → الاتجاه قصير الأجل صاعد
• قوة الاتجاه (ADX/DI، 15 دقيقة): ADX عند 37.1، والمشترون يسيطرون (DI+ عند 33.3 مقابل DI− عند 14.0) → المشترون يقودون الحركة
• مؤشر RSI لأربع ساعات: 56.3، زخم صعودي (أعلى من 55) → الزخم في صالح المشترين
المخاطر: الاتجاه اليومي: السعر < EMA50 < EMA200، ترتيب هبوطي → الاتجاه العام هابط
لماذا الآن؟
الاتجاه اليومي هبوطي، لكن 5 من أصل 12 إشارة مصطفّة تؤيد الشراء. الخطة هي التداول ضمن نطاق 0.0729287 – 0.0734513، وجني جزء من الأرباح عند 0.0781178 و0.0814029، والتحلي بالصبر انتظارًا للوصول إلى 0.0863307. إذا هبط السعر إلى ما دون 0.0666197، فهذا يعني أن الفكرة لم تعد صالحة، وسيؤدي وقف الخسارة دوره. هذه مراهنة عكس اتجاه الأطر الزمنية الأكبر، لذا قلّل حجم الصفقة.
هل يصل VELVET إلى 0.0781178 أولًا، أم يضرب وقف الخسارة؟
الرسم البياني أدناه يتضمن جميع المستويات.
📲 هل تريد المزيد من أحدث إشاراتي؟ انضم إليّ هنا:
https://app.binance.com/uni-qr/D26WbL9t
⚠️ هذا تحليل شخصي للسوق فقط. لا تُعد هذه نصيحة مالية — أدر المخاطر وأجرِ بحثك بنفسك.
محتوى تعليمي وليس نصيحة استثمارية أو توصية بشراء أي أصل أو بيعه أو إيداعه أو سحبه. لا توجد إعلانات مدفوعة أو روابط إحالة/تسويق بالعمولة.
1
604
·
--
صاعد
يبدو أن التراصف اليومي لـBR حقيقي، لكن إطار الساعة يقول: انتظر.
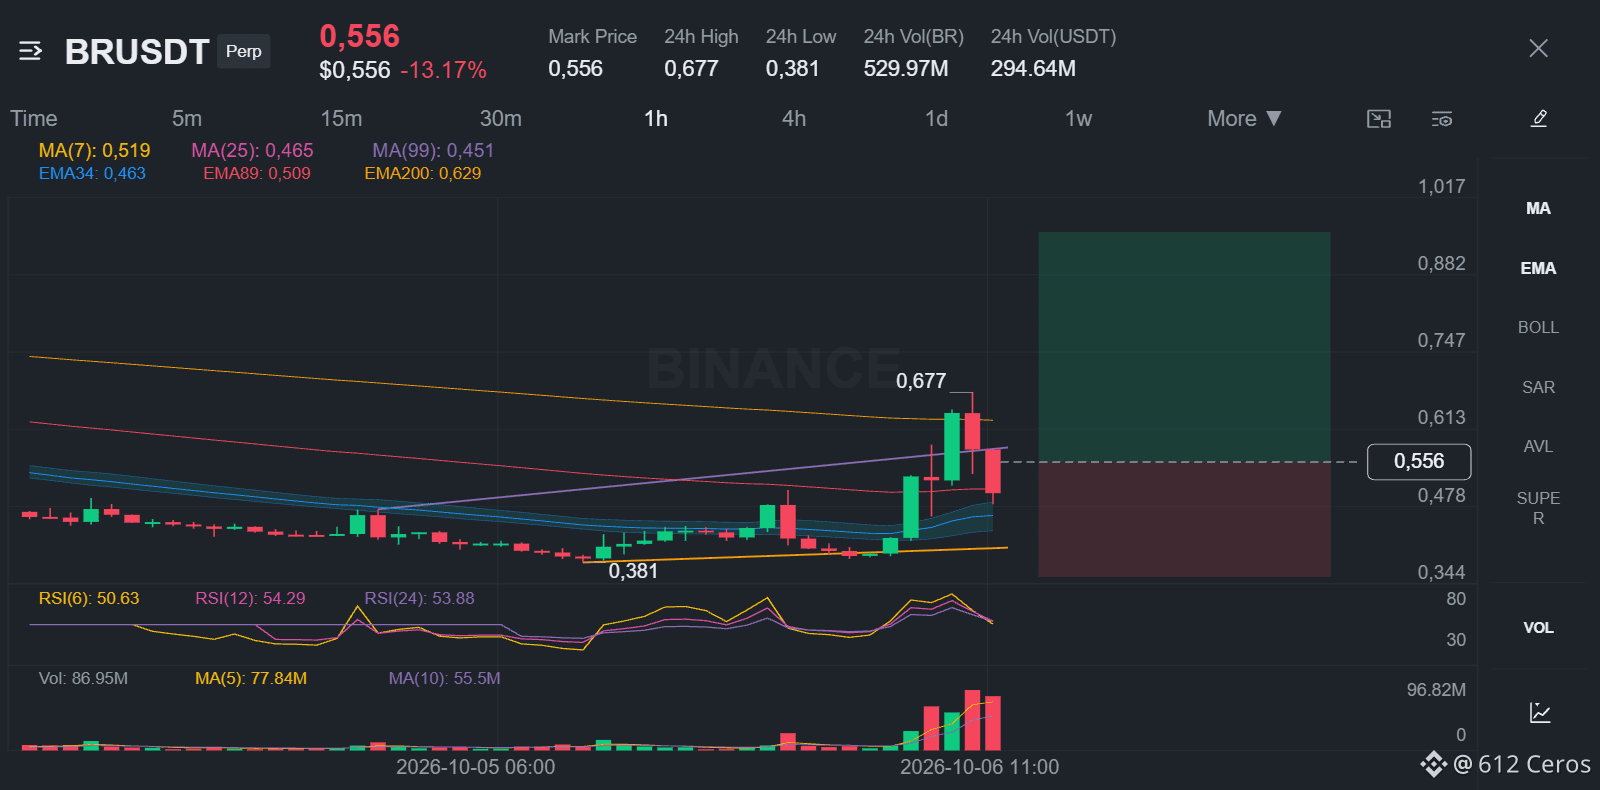
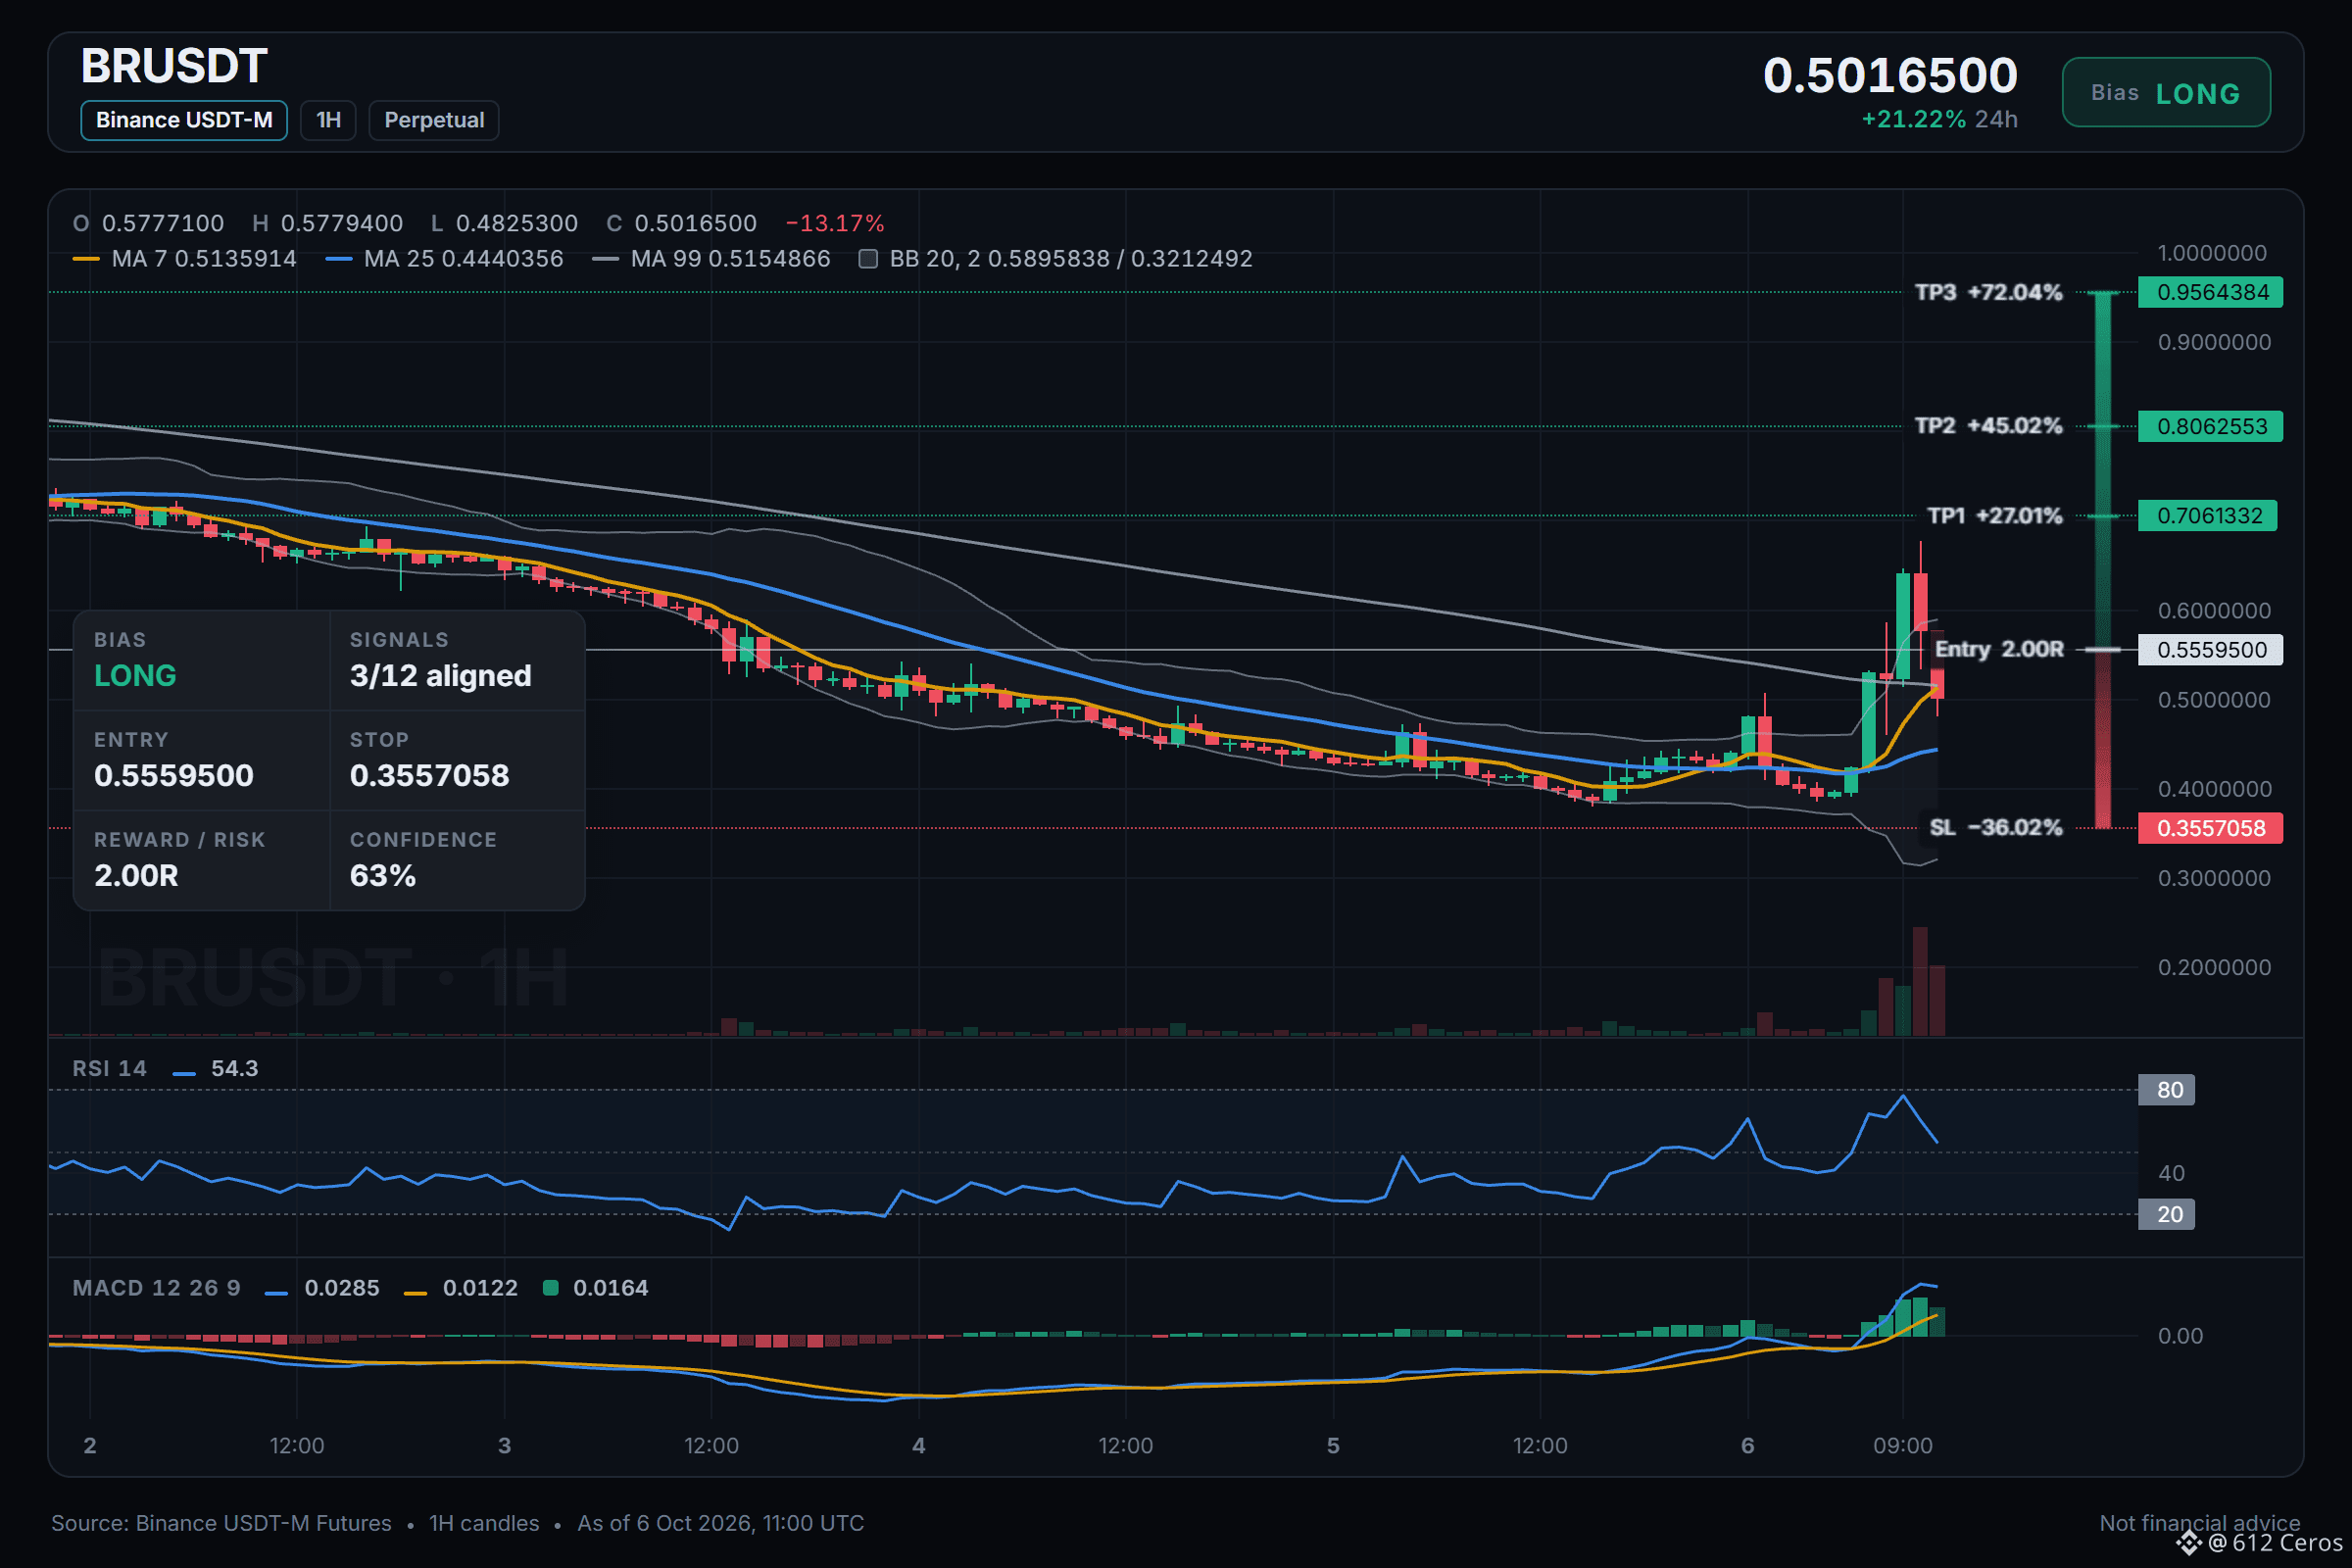
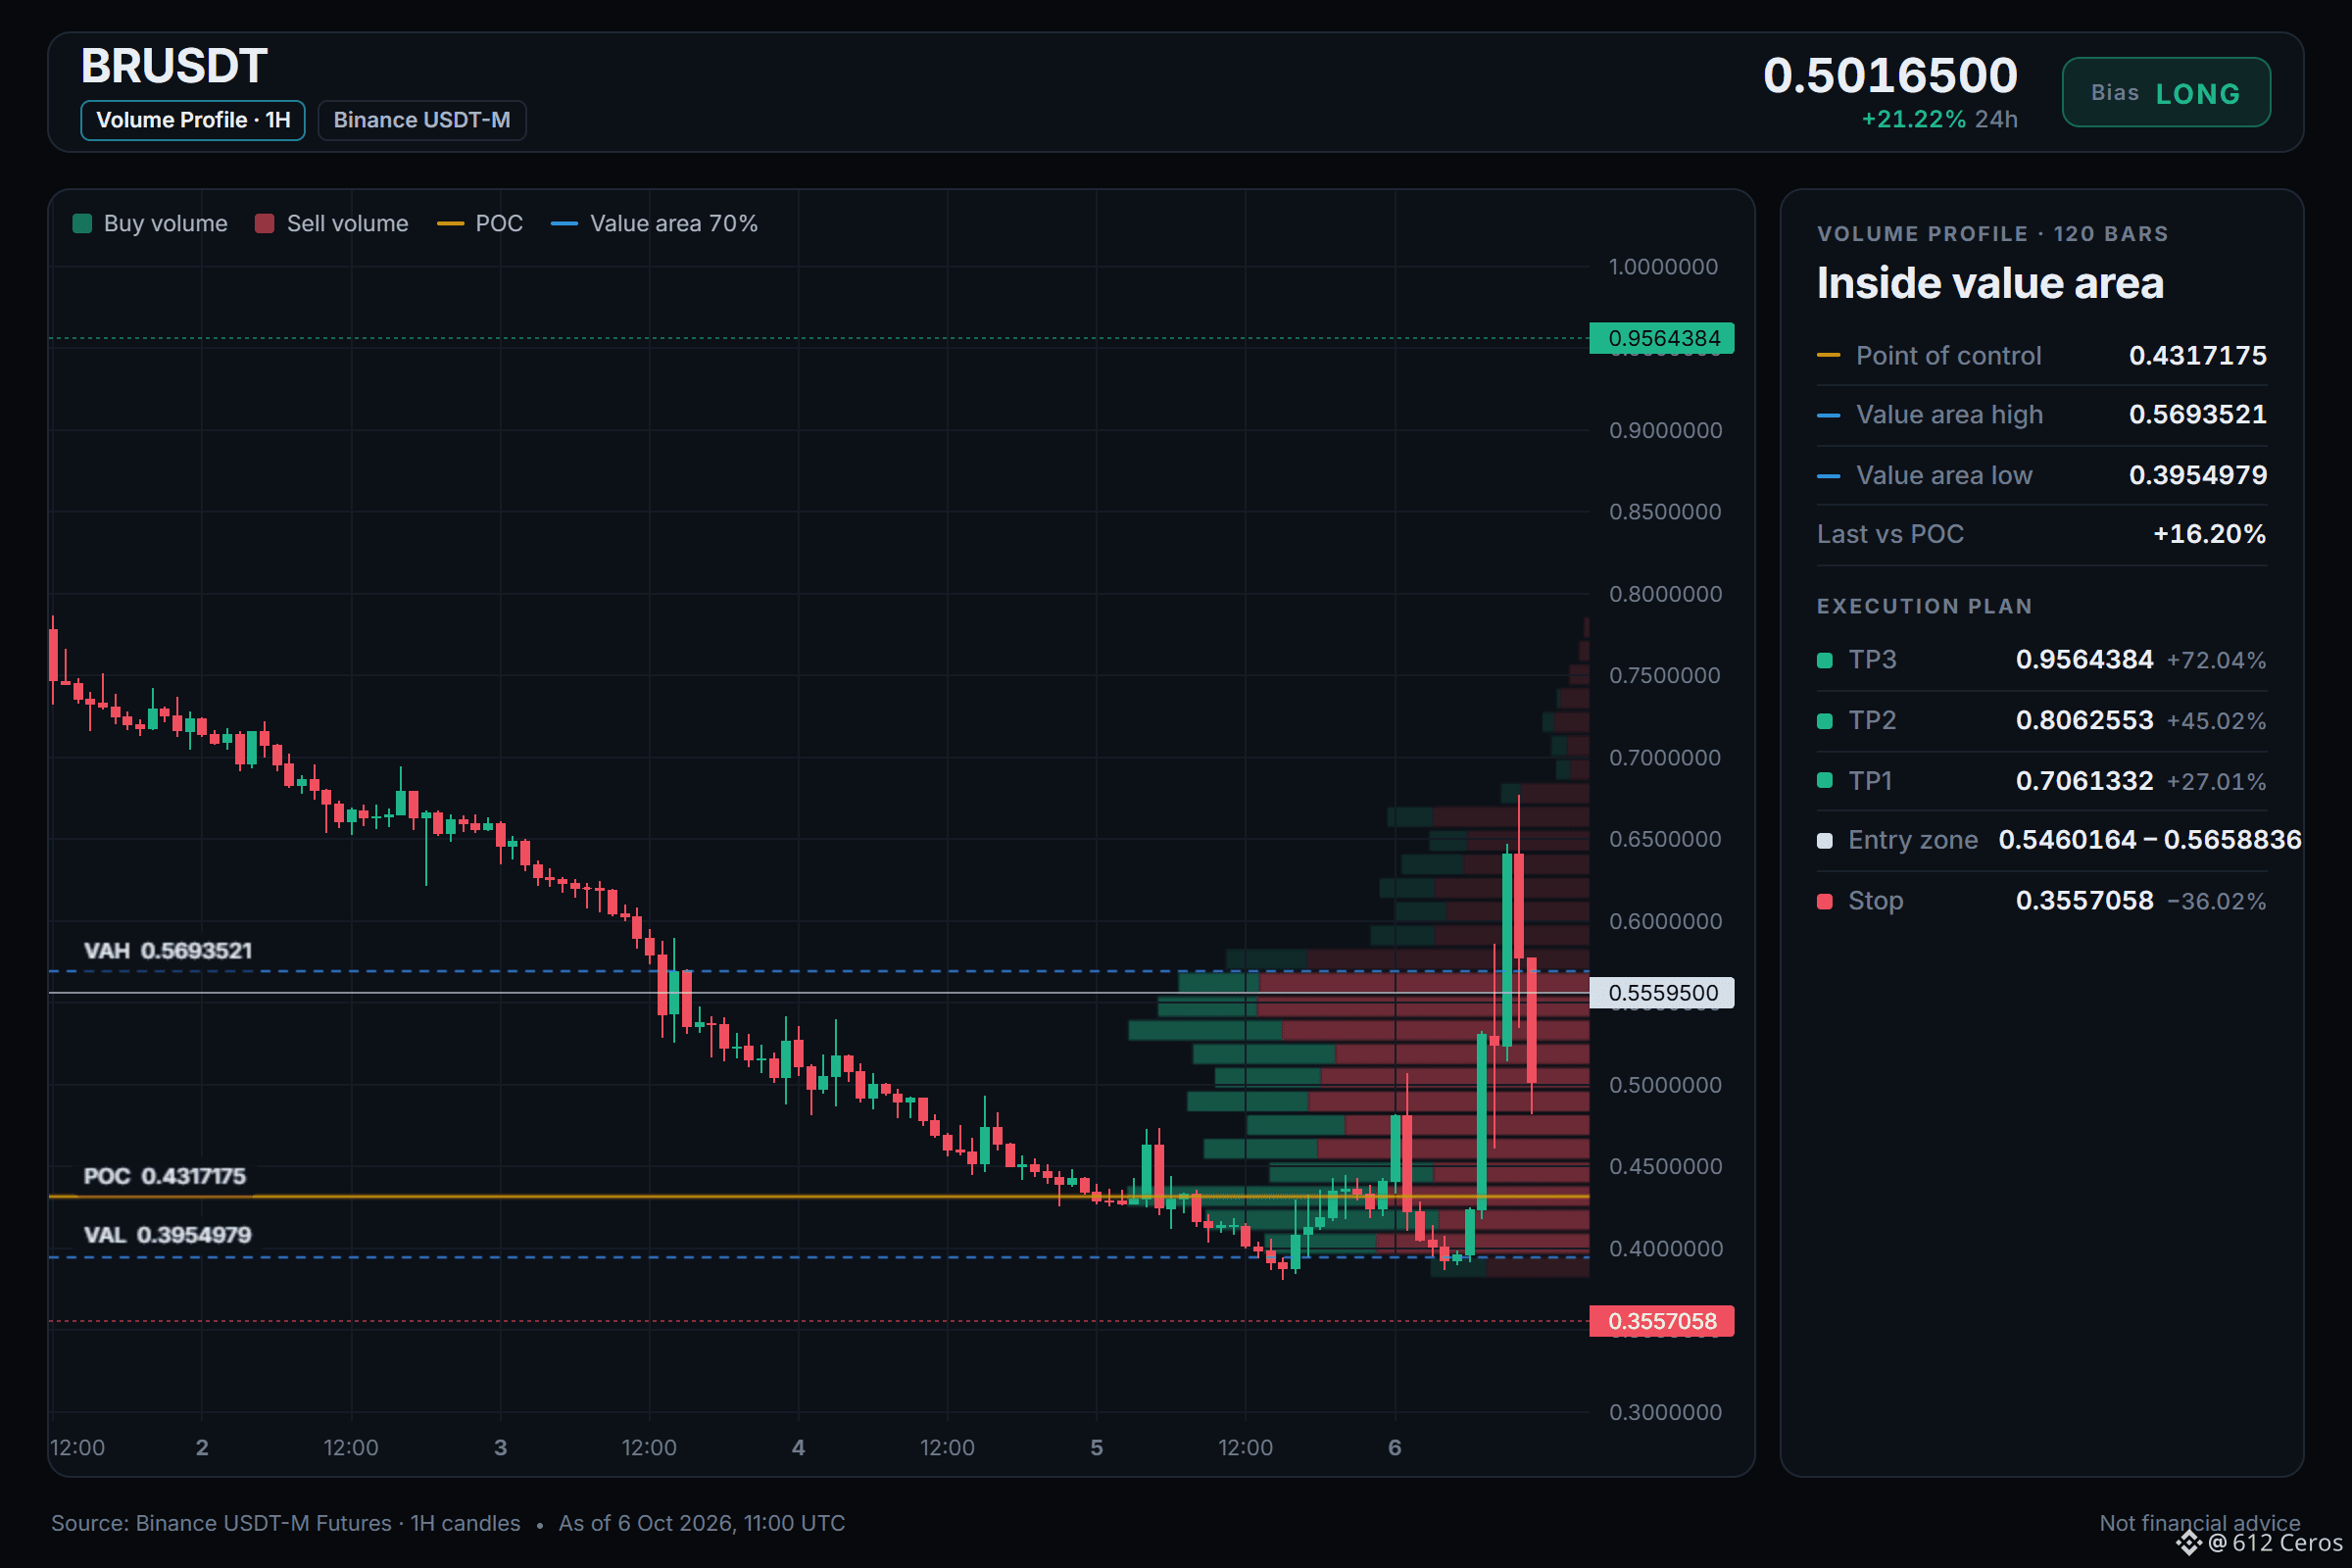
🟢 شراء $BR /USDT: التوقع أن يرتفع السعر
الانحياز: شراء · ميل للشراء
الدخول: 0.5460164 – 0.5658836
الهدف 1: 0.7061332 (+27.0%)
الهدف 2: 0.8062553 (+45.0%)
الهدف 3: 0.9564384 (+72.0%)
وقف الخسارة: 0.3557058 (-36.0%)
الخطة: ادخل فقط ضمن النطاق، وخذ نصف الكمية عند الهدف 1، ثم حرّك وقف الخسارة إلى نقطة الدخول.
ملاحظة: القناعة متوسطة فحسب، لذا اجعل حجم الصفقة صغيراً.
لماذا الشراء؟ إشارة تميل إلى الشراء؛ 3/12 من المؤشرات متوافقة، ولا توجد مؤشرات معاكسة، و9 غير حاسمة.
• الاتجاه اليومي: السعر > EMA50 > EMA200، وتراصف صعودي → الاتجاه العام صاعد
• قوة الاتجاه (ADX/DI، إطار 15 دقيقة): ADX عند 37.6 والمشترون مسيطرون (DI+ عند 30.6 مقابل DI− عند 20.6) → المشترون يقودون الحركة
• القوة النسبية مقابل BTC: أداء أفضل، +34.25% مقابل BTC خلال اليوم الماضي → أقوى من BTC
لماذا يعجبني هذا؟
الاتجاه اليومي صعودي، والسعر أعلى من EMA50 وEMA200، ما يشير إلى أن الاتجاه العام صاعد. يسيطر المشترون على إطار 15 دقيقة، إذ يبلغ ADX 37.6 ويتقدم المشترون بقيمة DI+ تبلغ 30.6 مقابل DI- عند 20.6. يقع الدخول عند 0.5559500، وهو مستوى السعر على إطار الساعة.
أين ستضع وقف الخسارة إذا دخلت صفقة شراء عند 0.5559500؟
المستويات محددة على الرسم البياني أدناه.
{future}(BRUSDT)
📲 أتريد المزيد من أحدث إشاراتي؟ انضم إليّ هنا:
[https://app.binance.com/uni-qr/D26WbL9t](https://app.binance.com/uni-qr/D26WbL9t)
⚠️ هذا تحليل شخصي للسوق فقط. ليس نصيحة مالية — أدر المخاطر بنفسك وأجرِ بحثك الخاص.
محتوى تعليمي، وليس نصيحة استثمارية أو توصية بشراء أي أصل أو بيعه أو إيداعه أو سحبه. لا توجد دعاية مدفوعة أو روابط إحالة/تسويق بالعمولة.
يبدو أن التراصف اليومي لـBR حقيقي، لكن إطار الساعة يقول: انتظر.
🟢 شراء $BR /USDT: التوقع أن يرتفع السعر
الانحياز: شراء · ميل للشراء
الدخول: 0.5460164 – 0.5658836
الهدف 1: 0.7061332 (+27.0%)
الهدف 2: 0.8062553 (+45.0%)
الهدف 3: 0.9564384 (+72.0%)
وقف الخسارة: 0.3557058 (-36.0%)
الخطة: ادخل فقط ضمن النطاق، وخذ نصف الكمية عند الهدف 1، ثم حرّك وقف الخسارة إلى نقطة الدخول.
ملاحظة: القناعة متوسطة فحسب، لذا اجعل حجم الصفقة صغيراً.
لماذا الشراء؟ إشارة تميل إلى الشراء؛ 3/12 من المؤشرات متوافقة، ولا توجد مؤشرات معاكسة، و9 غير حاسمة.
• الاتجاه اليومي: السعر > EMA50 > EMA200، وتراصف صعودي → الاتجاه العام صاعد
• قوة الاتجاه (ADX/DI، إطار 15 دقيقة): ADX عند 37.6 والمشترون مسيطرون (DI+ عند 30.6 مقابل DI− عند 20.6) → المشترون يقودون الحركة
• القوة النسبية مقابل BTC: أداء أفضل، +34.25% مقابل BTC خلال اليوم الماضي → أقوى من BTC
لماذا يعجبني هذا؟
الاتجاه اليومي صعودي، والسعر أعلى من EMA50 وEMA200، ما يشير إلى أن الاتجاه العام صاعد. يسيطر المشترون على إطار 15 دقيقة، إذ يبلغ ADX 37.6 ويتقدم المشترون بقيمة DI+ تبلغ 30.6 مقابل DI- عند 20.6. يقع الدخول عند 0.5559500، وهو مستوى السعر على إطار الساعة.
أين ستضع وقف الخسارة إذا دخلت صفقة شراء عند 0.5559500؟
المستويات محددة على الرسم البياني أدناه.
📲 أتريد المزيد من أحدث إشاراتي؟ انضم إليّ هنا:
https://app.binance.com/uni-qr/D26WbL9t
⚠️ هذا تحليل شخصي للسوق فقط. ليس نصيحة مالية — أدر المخاطر بنفسك وأجرِ بحثك الخاص.
محتوى تعليمي، وليس نصيحة استثمارية أو توصية بشراء أي أصل أو بيعه أو إيداعه أو سحبه. لا توجد دعاية مدفوعة أو روابط إحالة/تسويق بالعمولة.
🟢 شراء $BR /USDT: التوقع أن يرتفع السعر
الانحياز: شراء · ميل للشراء
الدخول: 0.5460164 – 0.5658836
الهدف 1: 0.7061332 (+27.0%)
الهدف 2: 0.8062553 (+45.0%)
الهدف 3: 0.9564384 (+72.0%)
وقف الخسارة: 0.3557058 (-36.0%)
الخطة: ادخل فقط ضمن النطاق، وخذ نصف الكمية عند الهدف 1، ثم حرّك وقف الخسارة إلى نقطة الدخول.
ملاحظة: القناعة متوسطة فحسب، لذا اجعل حجم الصفقة صغيراً.
لماذا الشراء؟ إشارة تميل إلى الشراء؛ 3/12 من المؤشرات متوافقة، ولا توجد مؤشرات معاكسة، و9 غير حاسمة.
• الاتجاه اليومي: السعر > EMA50 > EMA200، وتراصف صعودي → الاتجاه العام صاعد
• قوة الاتجاه (ADX/DI، إطار 15 دقيقة): ADX عند 37.6 والمشترون مسيطرون (DI+ عند 30.6 مقابل DI− عند 20.6) → المشترون يقودون الحركة
• القوة النسبية مقابل BTC: أداء أفضل، +34.25% مقابل BTC خلال اليوم الماضي → أقوى من BTC
لماذا يعجبني هذا؟
الاتجاه اليومي صعودي، والسعر أعلى من EMA50 وEMA200، ما يشير إلى أن الاتجاه العام صاعد. يسيطر المشترون على إطار 15 دقيقة، إذ يبلغ ADX 37.6 ويتقدم المشترون بقيمة DI+ تبلغ 30.6 مقابل DI- عند 20.6. يقع الدخول عند 0.5559500، وهو مستوى السعر على إطار الساعة.
أين ستضع وقف الخسارة إذا دخلت صفقة شراء عند 0.5559500؟
المستويات محددة على الرسم البياني أدناه.
📲 أتريد المزيد من أحدث إشاراتي؟ انضم إليّ هنا:
https://app.binance.com/uni-qr/D26WbL9t
⚠️ هذا تحليل شخصي للسوق فقط. ليس نصيحة مالية — أدر المخاطر بنفسك وأجرِ بحثك الخاص.
محتوى تعليمي، وليس نصيحة استثمارية أو توصية بشراء أي أصل أو بيعه أو إيداعه أو سحبه. لا توجد دعاية مدفوعة أو روابط إحالة/تسويق بالعمولة.
1
646
·
--
صاعد
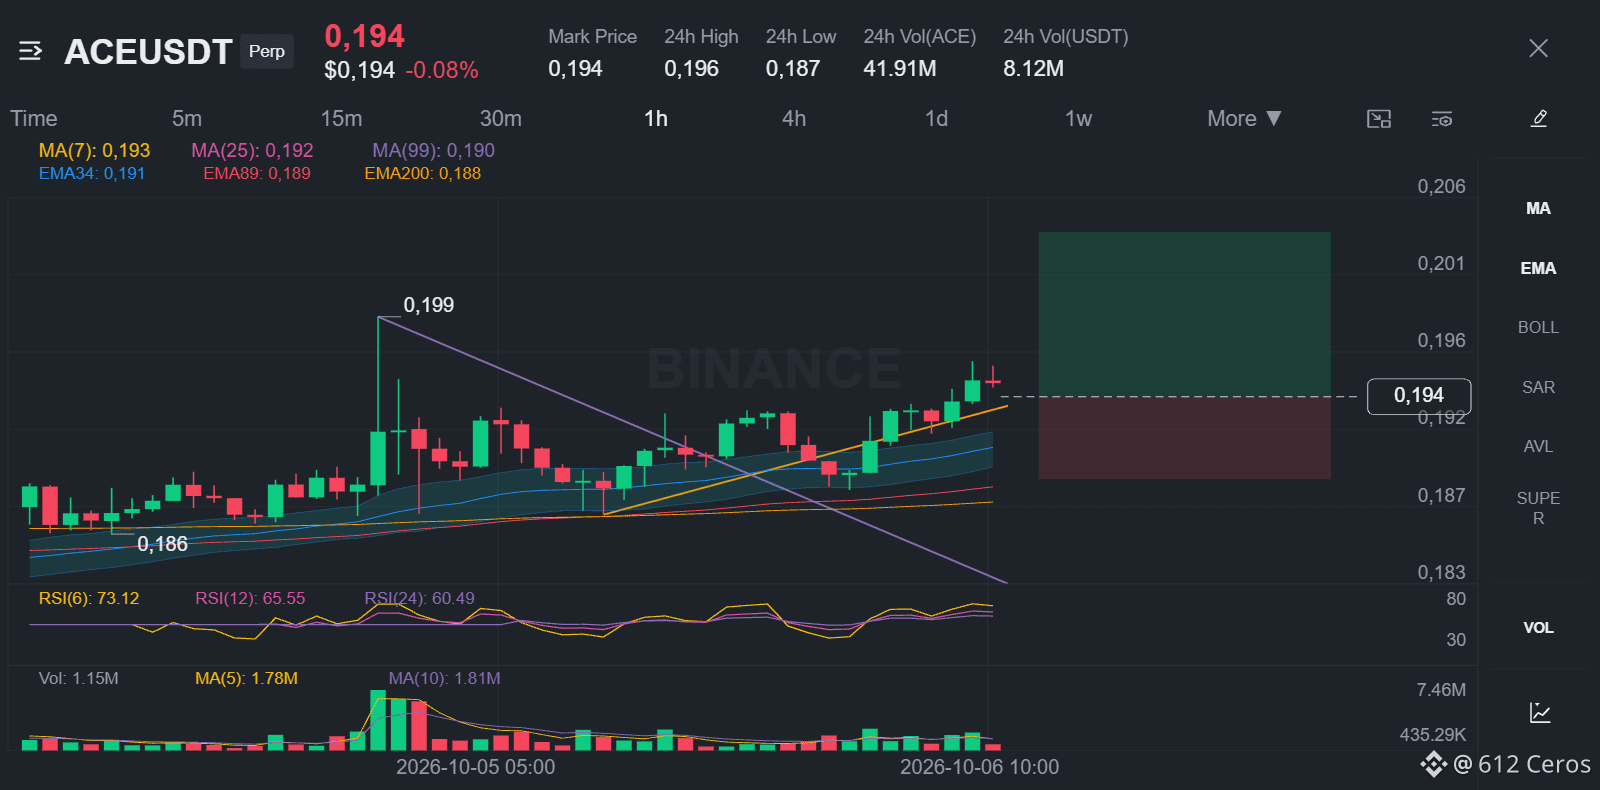
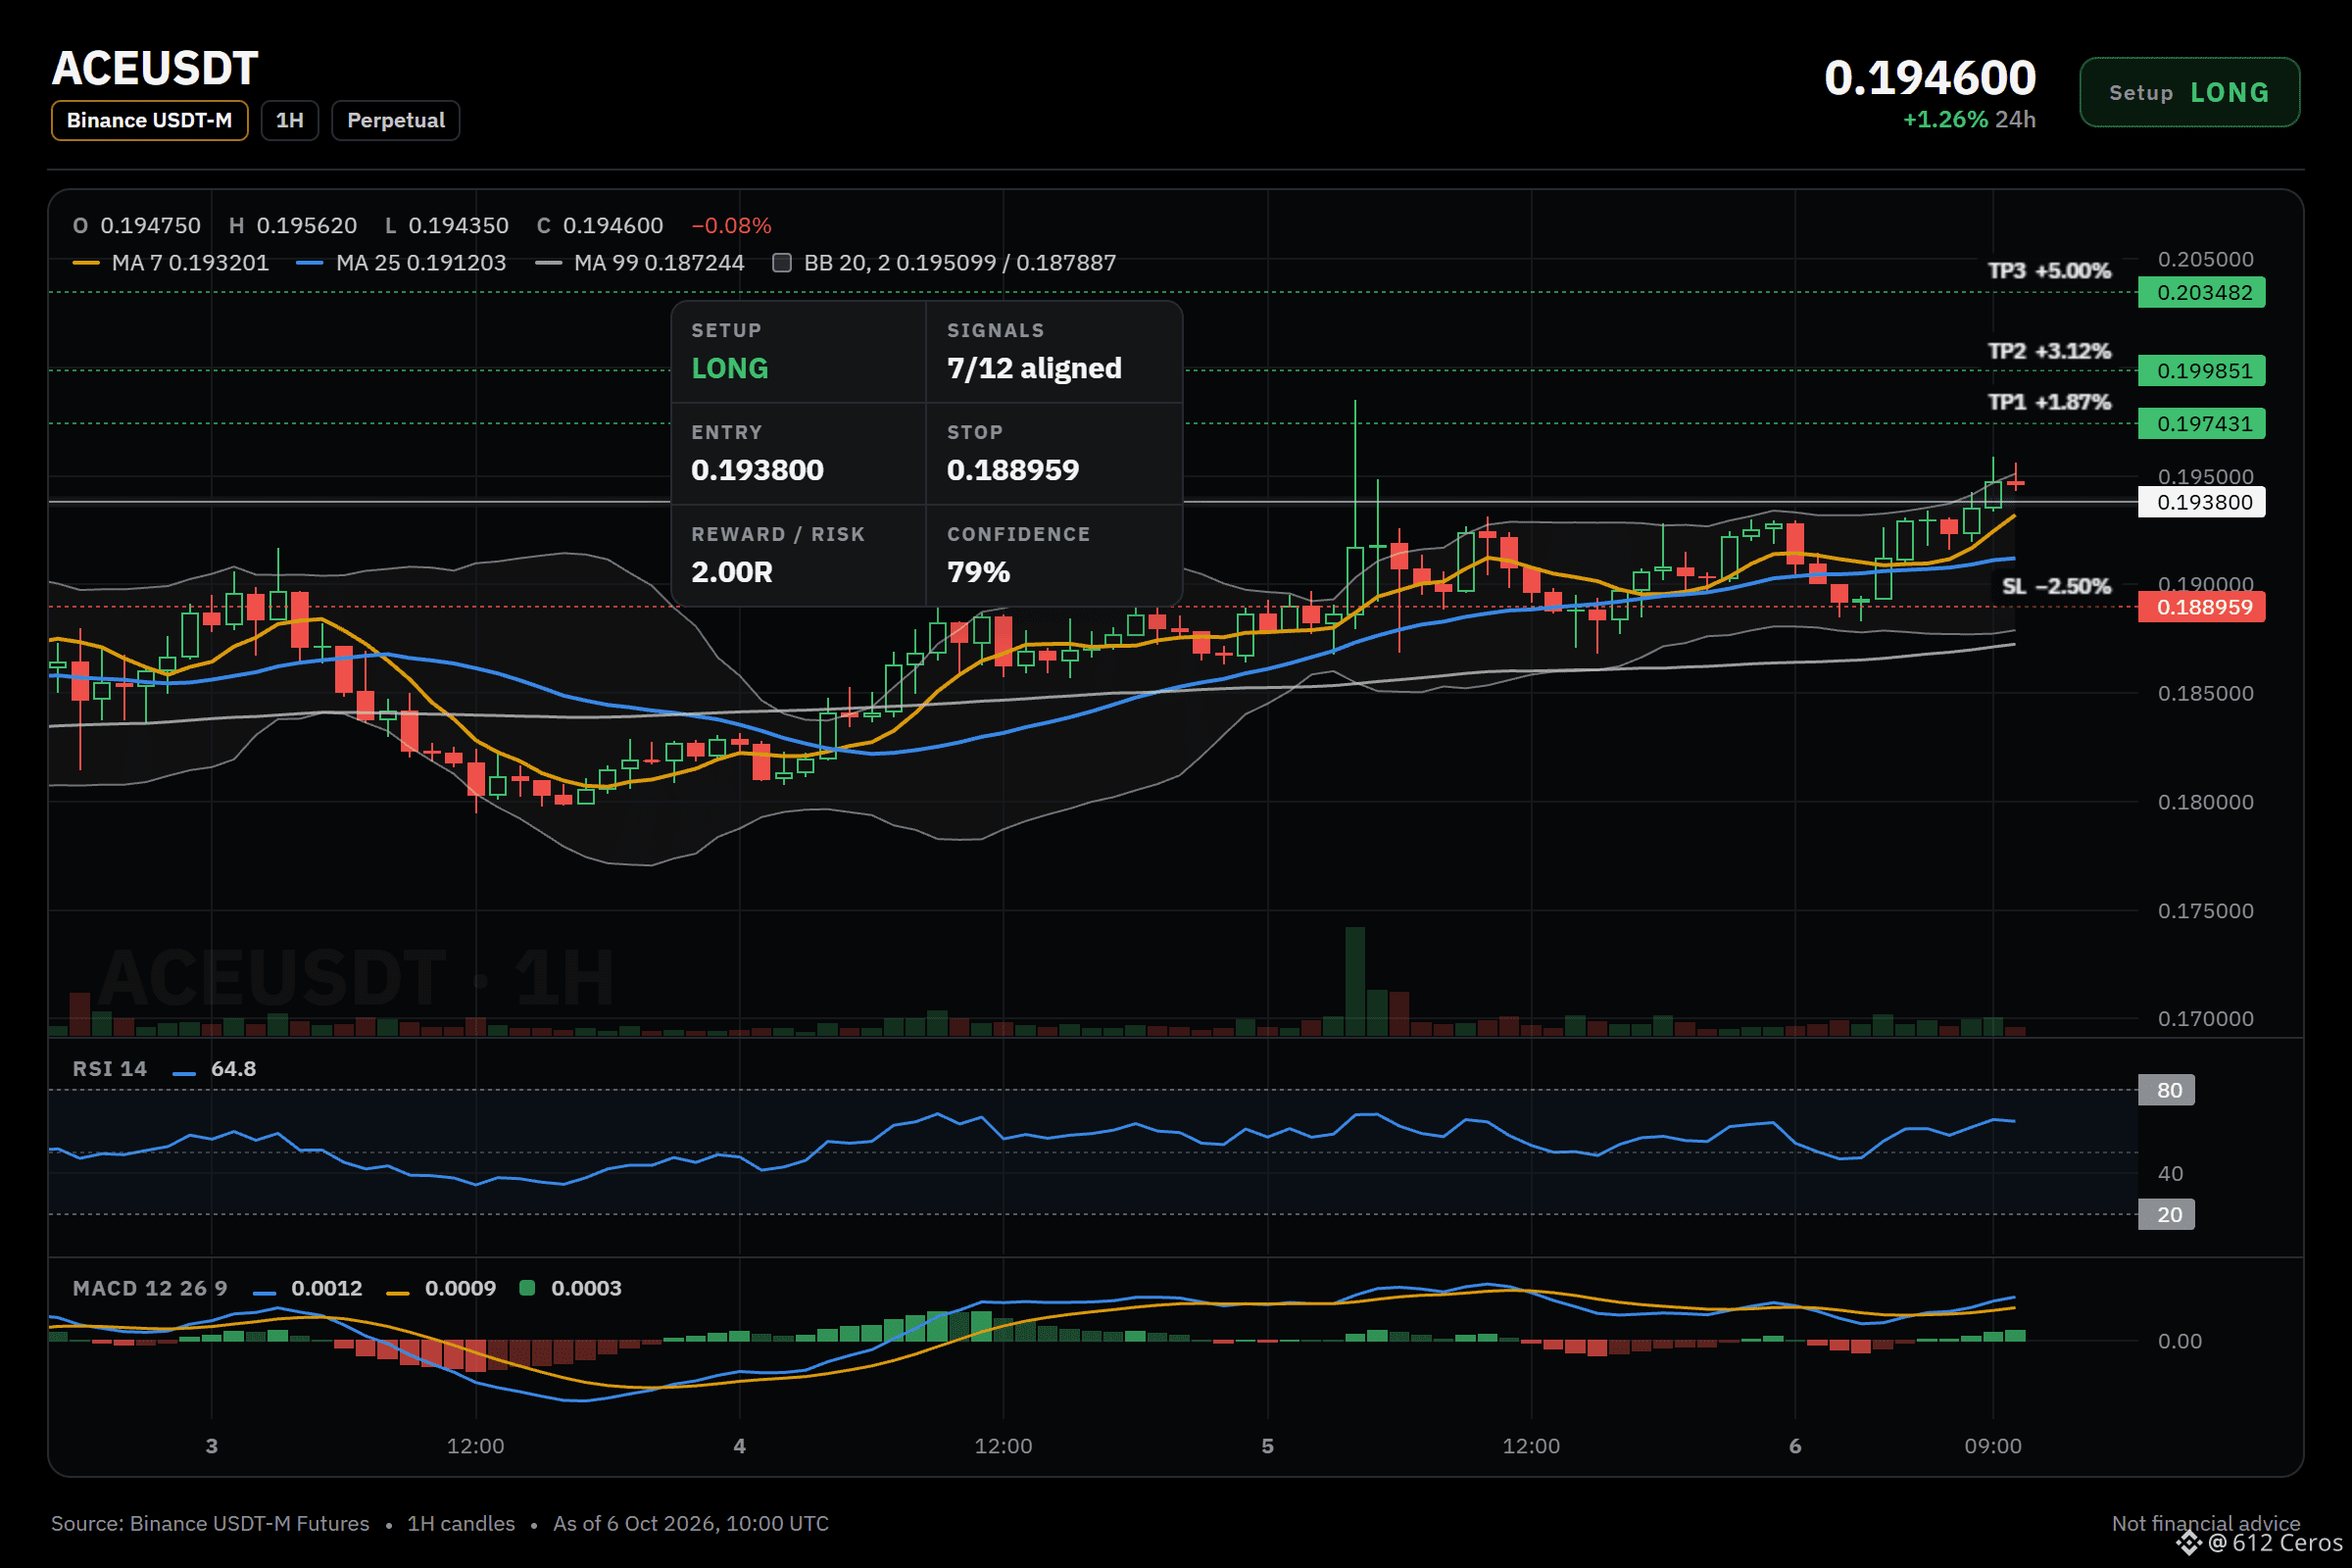
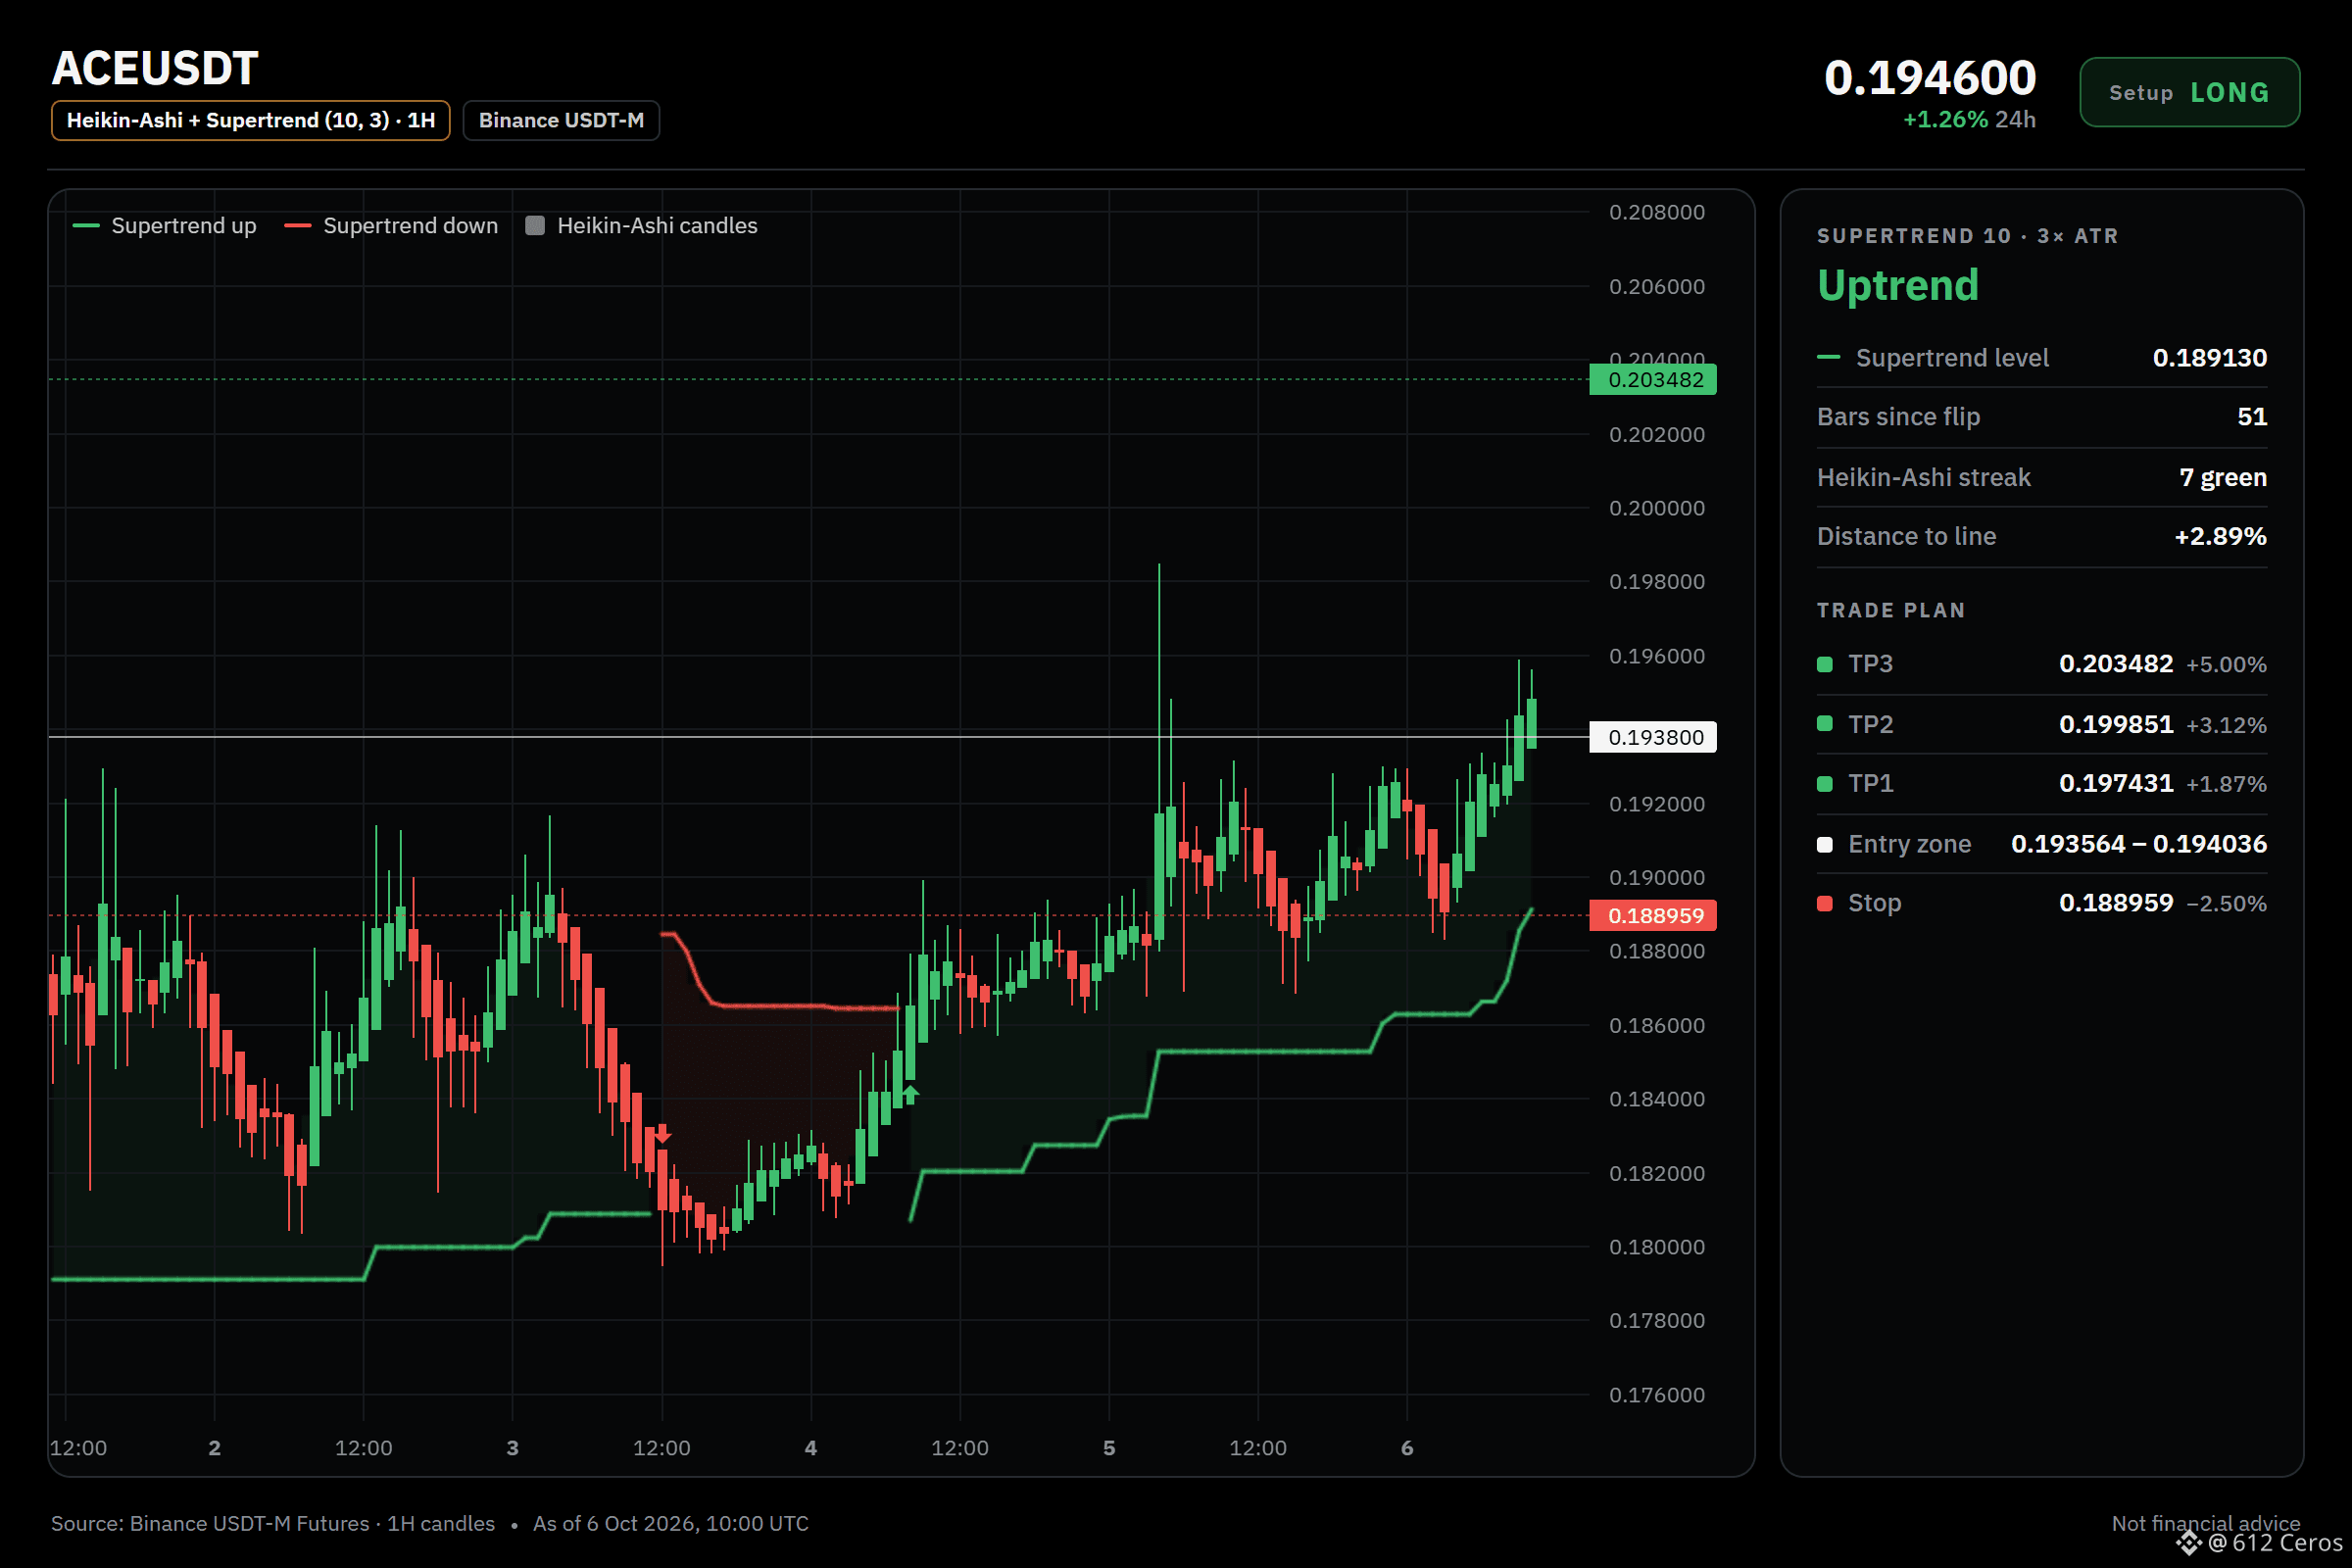
هل يواصل ACE بهدوء تكديس الاتجاهات الصعودية عبر جميع الأطر الزمنية؟
🟢 شراء $ACE /USDT: توقعات بارتفاع السعر
الميل: شراء · قوي
الدخول: 0.193564 – 0.194036
الهدف 1: 0.197431 (+1.9%)
الهدف 2: 0.199851 (+3.1%)
الهدف 3: 0.203482 (+5.0%)
وقف الخسارة: 0.188959 (-2.5%)
الخطة: ادخل ضمن النطاق فقط، وجنِ نصف الأرباح عند الهدف 1، ثم حرّك وقف الخسارة إلى سعر الدخول.
لماذا الشراء؟ إشارة قوية، 7/12 من المؤشرات تؤيدها، ولا يعارضها أي مؤشر، و5 غير حاسمة.
• الاتجاه اليومي: السعر > EMA50 > EMA200، ترتيب صعودي → الاتجاه العام صاعد
• اتجاه 4 ساعات: السعر > EMA50 > EMA200، ترتيب صعودي → اتجاه التأرجح صاعد
• اتجاه ساعة واحدة: السعر > EMA50 > EMA200، ترتيب صعودي → الاتجاه قصير الأجل صاعد
الخطة أ:
إذا استمرت الاتجاهات اليومية واتجاهات 4 ساعات وساعة واحدة في الصعود، فقد يواصل السعر ارتفاعه نحو الهدف الأول مع سيطرة المشترين.
الخطة ب (إبطال الإعداد):
اختراق مستوى وقف الخسارة يبطل الإعداد، لذا عليك الخروج فورًا.
ما المستوى الذي ستحدده بنفسك إذا كنت تنتظر تراجعًا للسعر بدلًا من ذلك؟
الإعداد الكامل موضح في الرسم البياني أدناه.
{future}(ACEUSDT)
📲 هل تريد المزيد من أحدث إشاراتي؟ انضم إليّ من هنا:
[https://app.binance.com/uni-qr/D26WbL9t](https://app.binance.com/uni-qr/D26WbL9t)
⚠️ هذا تحليل شخصي للسوق فقط. ليس نصيحة مالية — أدر المخاطر وابحث بنفسك.
محتوى تعليمي، وليس نصيحة استثمارية أو توصية بشراء أي أصل أو بيعه أو إيداعه أو سحبه. لا توجد عروض ترويجية مدفوعة أو روابط إحالة/تسويق بالعمولة.
هل يواصل ACE بهدوء تكديس الاتجاهات الصعودية عبر جميع الأطر الزمنية؟
🟢 شراء $ACE /USDT: توقعات بارتفاع السعر
الميل: شراء · قوي
الدخول: 0.193564 – 0.194036
الهدف 1: 0.197431 (+1.9%)
الهدف 2: 0.199851 (+3.1%)
الهدف 3: 0.203482 (+5.0%)
وقف الخسارة: 0.188959 (-2.5%)
الخطة: ادخل ضمن النطاق فقط، وجنِ نصف الأرباح عند الهدف 1، ثم حرّك وقف الخسارة إلى سعر الدخول.
لماذا الشراء؟ إشارة قوية، 7/12 من المؤشرات تؤيدها، ولا يعارضها أي مؤشر، و5 غير حاسمة.
• الاتجاه اليومي: السعر > EMA50 > EMA200، ترتيب صعودي → الاتجاه العام صاعد
• اتجاه 4 ساعات: السعر > EMA50 > EMA200، ترتيب صعودي → اتجاه التأرجح صاعد
• اتجاه ساعة واحدة: السعر > EMA50 > EMA200، ترتيب صعودي → الاتجاه قصير الأجل صاعد
الخطة أ:
إذا استمرت الاتجاهات اليومية واتجاهات 4 ساعات وساعة واحدة في الصعود، فقد يواصل السعر ارتفاعه نحو الهدف الأول مع سيطرة المشترين.
الخطة ب (إبطال الإعداد):
اختراق مستوى وقف الخسارة يبطل الإعداد، لذا عليك الخروج فورًا.
ما المستوى الذي ستحدده بنفسك إذا كنت تنتظر تراجعًا للسعر بدلًا من ذلك؟
الإعداد الكامل موضح في الرسم البياني أدناه.
📲 هل تريد المزيد من أحدث إشاراتي؟ انضم إليّ من هنا:
https://app.binance.com/uni-qr/D26WbL9t
⚠️ هذا تحليل شخصي للسوق فقط. ليس نصيحة مالية — أدر المخاطر وابحث بنفسك.
محتوى تعليمي، وليس نصيحة استثمارية أو توصية بشراء أي أصل أو بيعه أو إيداعه أو سحبه. لا توجد عروض ترويجية مدفوعة أو روابط إحالة/تسويق بالعمولة.
🟢 شراء $ACE /USDT: توقعات بارتفاع السعر
الميل: شراء · قوي
الدخول: 0.193564 – 0.194036
الهدف 1: 0.197431 (+1.9%)
الهدف 2: 0.199851 (+3.1%)
الهدف 3: 0.203482 (+5.0%)
وقف الخسارة: 0.188959 (-2.5%)
الخطة: ادخل ضمن النطاق فقط، وجنِ نصف الأرباح عند الهدف 1، ثم حرّك وقف الخسارة إلى سعر الدخول.
لماذا الشراء؟ إشارة قوية، 7/12 من المؤشرات تؤيدها، ولا يعارضها أي مؤشر، و5 غير حاسمة.
• الاتجاه اليومي: السعر > EMA50 > EMA200، ترتيب صعودي → الاتجاه العام صاعد
• اتجاه 4 ساعات: السعر > EMA50 > EMA200، ترتيب صعودي → اتجاه التأرجح صاعد
• اتجاه ساعة واحدة: السعر > EMA50 > EMA200، ترتيب صعودي → الاتجاه قصير الأجل صاعد
الخطة أ:
إذا استمرت الاتجاهات اليومية واتجاهات 4 ساعات وساعة واحدة في الصعود، فقد يواصل السعر ارتفاعه نحو الهدف الأول مع سيطرة المشترين.
الخطة ب (إبطال الإعداد):
اختراق مستوى وقف الخسارة يبطل الإعداد، لذا عليك الخروج فورًا.
ما المستوى الذي ستحدده بنفسك إذا كنت تنتظر تراجعًا للسعر بدلًا من ذلك؟
الإعداد الكامل موضح في الرسم البياني أدناه.
📲 هل تريد المزيد من أحدث إشاراتي؟ انضم إليّ من هنا:
https://app.binance.com/uni-qr/D26WbL9t
⚠️ هذا تحليل شخصي للسوق فقط. ليس نصيحة مالية — أدر المخاطر وابحث بنفسك.
محتوى تعليمي، وليس نصيحة استثمارية أو توصية بشراء أي أصل أو بيعه أو إيداعه أو سحبه. لا توجد عروض ترويجية مدفوعة أو روابط إحالة/تسويق بالعمولة.
2
695
·
--
هابط
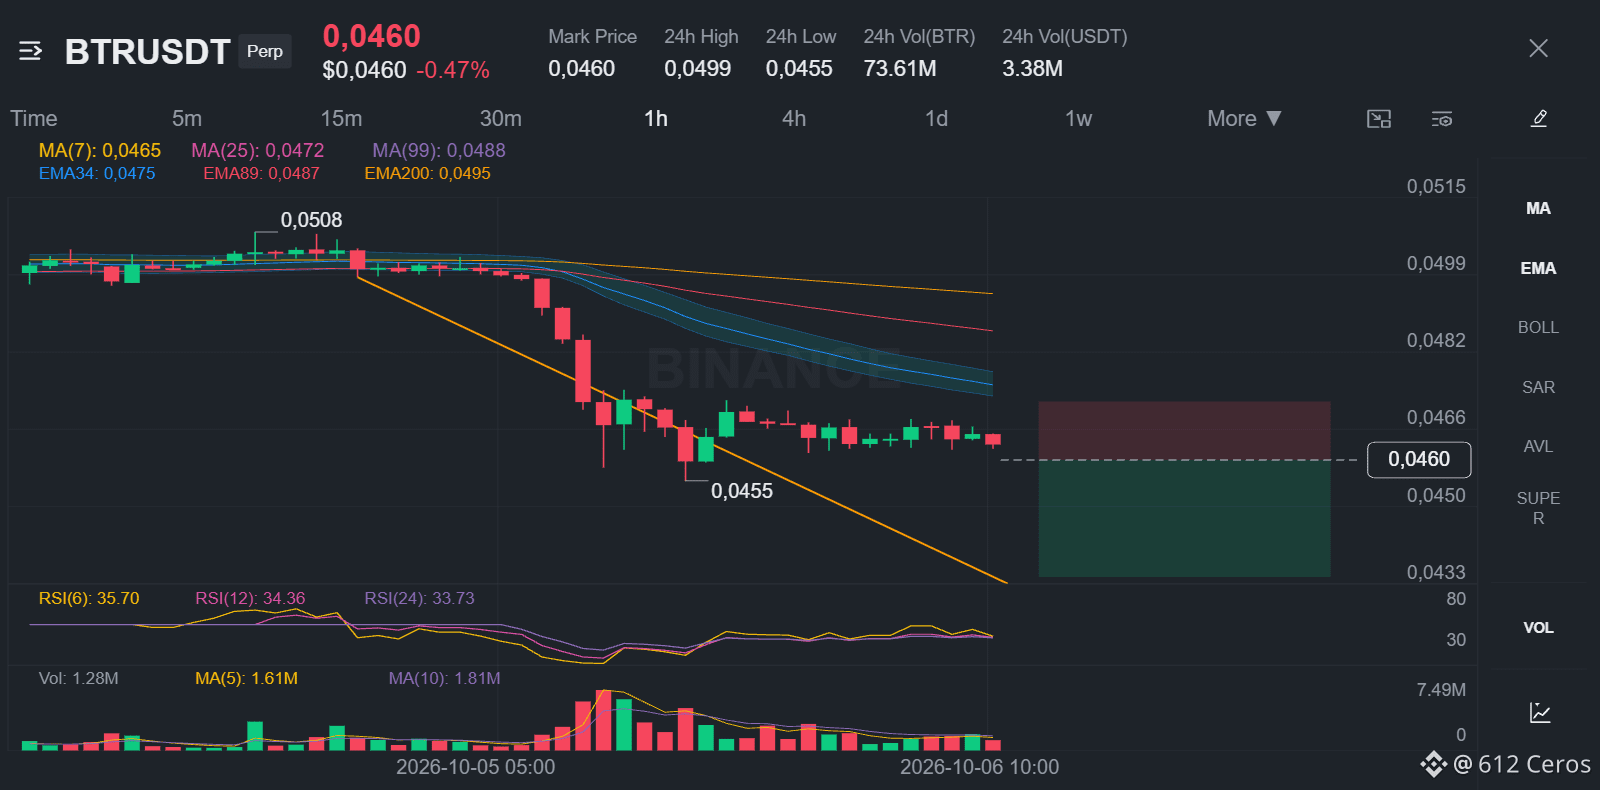
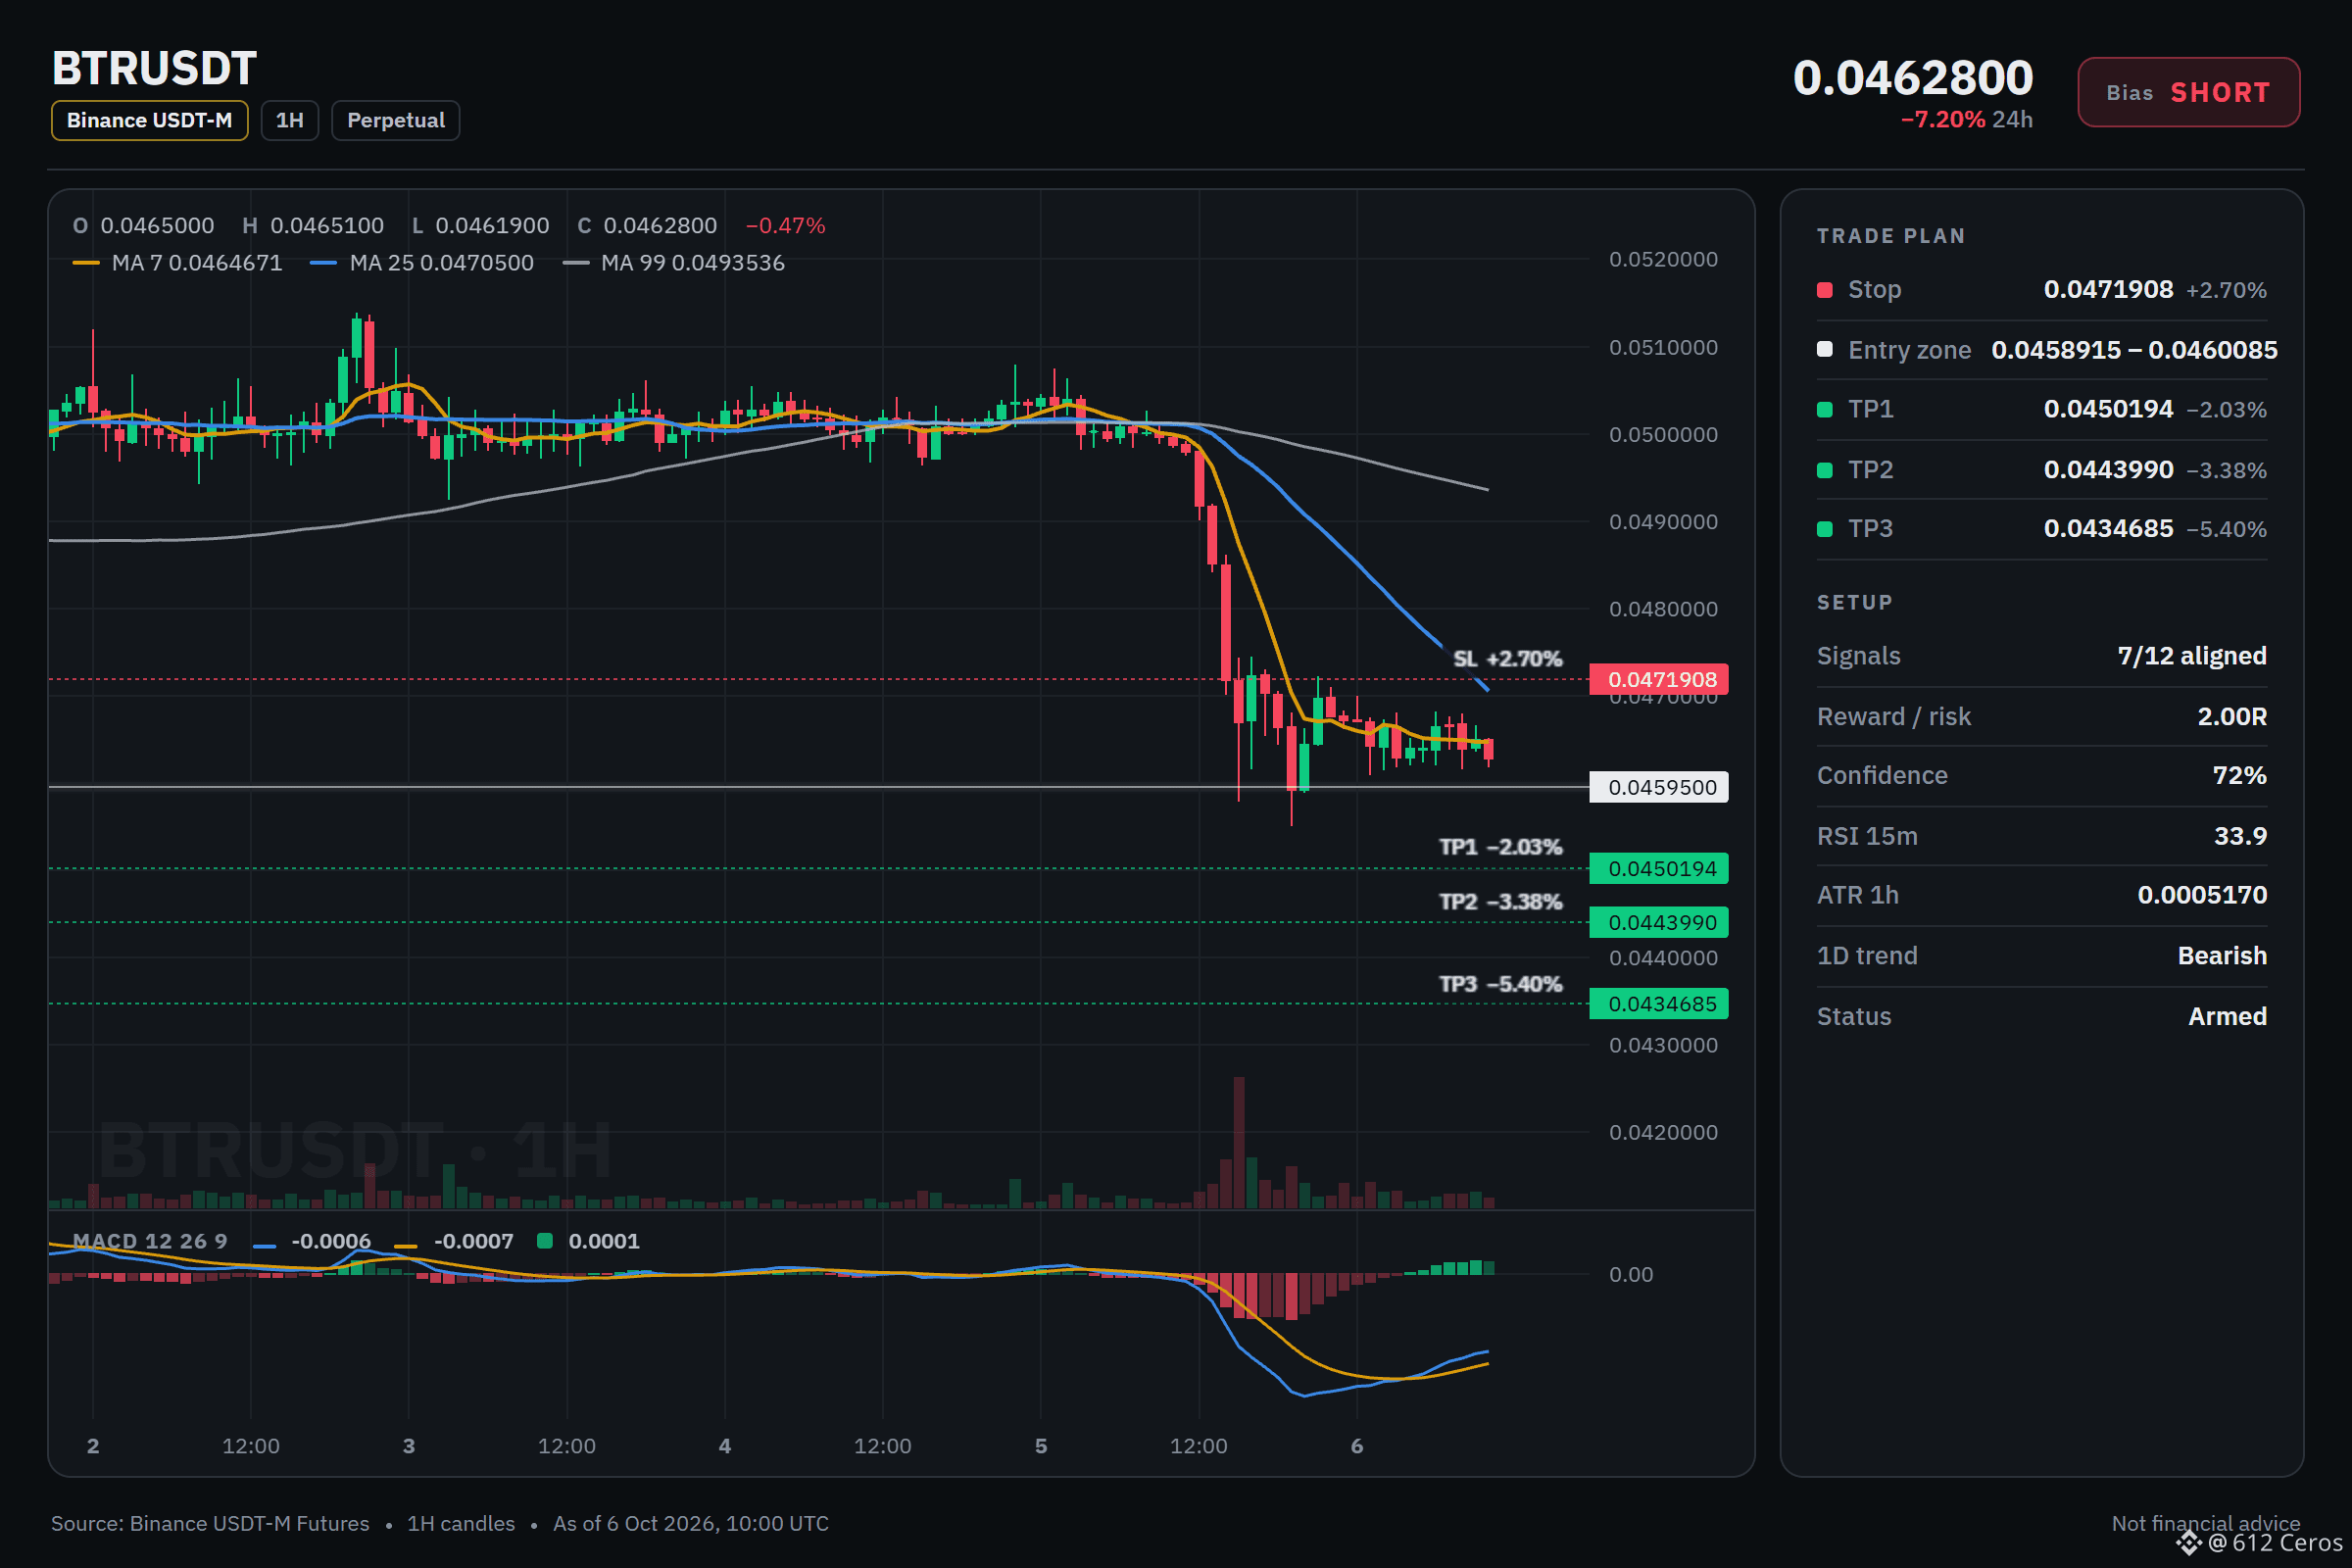
يحافظ BTR على ترتيب هبوطي يتجاهله الجميع.
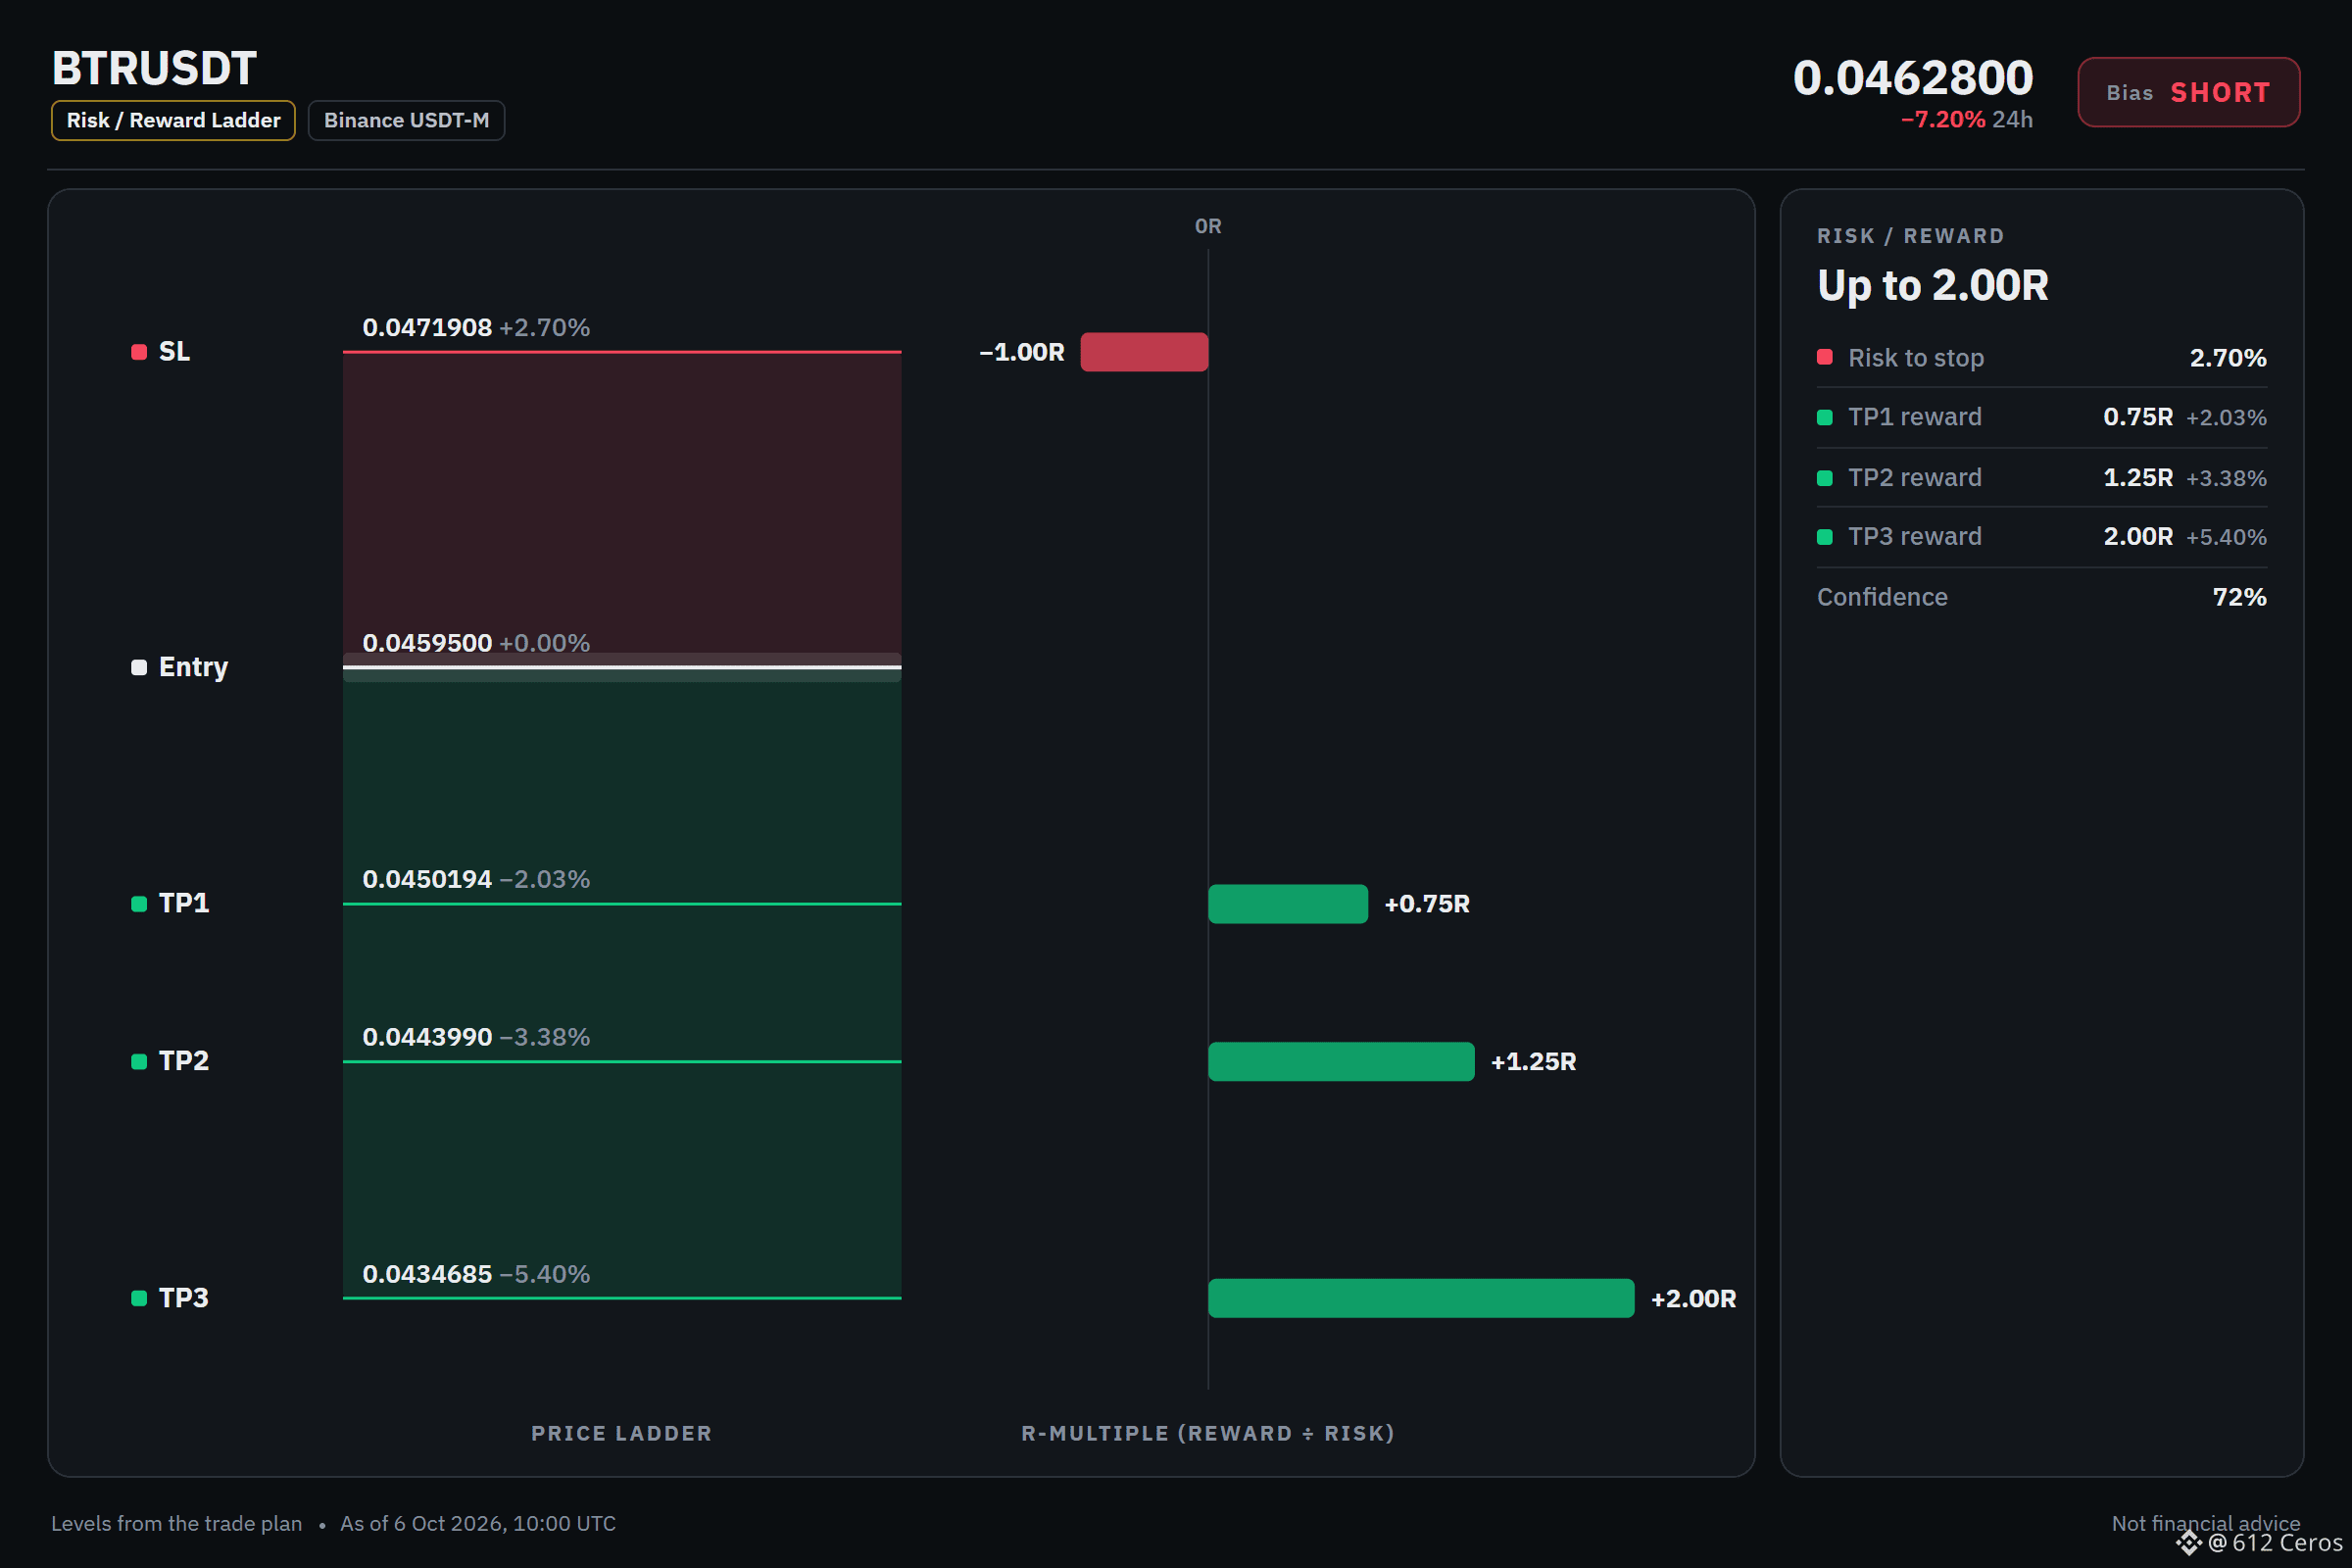
🔴 بيع على المكشوف $BTR /USDT: نتوقع أن يهبط السعر
التوجه: بيع على المكشوف · قوي
الدخول: 0.0458915 – 0.0460085
الهدف 1: 0.0450194 (-2.0%)
الهدف 2: 0.0443990 (-3.4%)
الهدف 3: 0.0434685 (-5.4%)
وقف الخسارة: 0.0471908 (+2.7%)
الخطة: ادخل فقط ضمن النطاق، وجنِ نصف الأرباح عند الهدف 1، ثم انقل وقف الخسارة إلى سعر الدخول.
لماذا البيع على المكشوف؟ قائمة تحقق BTR: تتفق 7/12 إشارة، وتعارضها إشارتان، و3 غير حاسمة
• الاتجاه اليومي: السعر < EMA50 < EMA200، ترتيب هبوطي → الاتجاه العام هابط
• اتجاه 4 ساعات: السعر < EMA50 < EMA200، ترتيب هبوطي → اتجاه التأرجح هابط
• اتجاه ساعة واحدة: السعر < EMA50 < EMA200، ترتيب هبوطي → الاتجاه قصير الأجل هابط
تنبيه: المسافة عن EMA50 على إطار الساعة: −4.1 ATR عن EMA50 على إطار الساعة، تشبّع مفرط مع خطر الارتداد → هبط السعر كثيرًا دون متوسطه، ومن المرجح حدوث ارتداد
تنبيه: تصبح الفكرة خاطئة إذا بلغ السعر وقف الخسارة عند 0.0471908
الخلاصة: يشكل ترتيب الاتجاه الهبوطي اليومي أقوى دعم، بينما يحذر خطر الارتداد على إطار الساعة بسبب تشبّع مؤشر RSI بالبيع من الدخول في هذه الصفقة.
لو كنت عند مستوى الدخول، هل ستظل تبيع على المكشوف أم تنتظر ارتدادًا؟
المستويات محددة على الرسم البياني أدناه.
{future}(BTRUSDT)
📲 أتريد المزيد من أحدث إشاراتي؟ انضم إليّ هنا:
[https://app.binance.com/uni-qr/D26WbL9t](https://app.binance.com/uni-qr/D26WbL9t)
⚠️ هذا تحليل شخصي للسوق فقط. لا تُعد هذه توصية مالية — أدر المخاطر وأجرِ أبحاثك الخاصة.
محتوى تعليمي، وليس نصيحة استثمارية أو توصية بشراء أي أصل أو بيعه أو إيداعه أو سحبه. لا يوجد ترويج مدفوع أو روابط إحالة/شراكة.
يحافظ BTR على ترتيب هبوطي يتجاهله الجميع.
🔴 بيع على المكشوف $BTR /USDT: نتوقع أن يهبط السعر
التوجه: بيع على المكشوف · قوي
الدخول: 0.0458915 – 0.0460085
الهدف 1: 0.0450194 (-2.0%)
الهدف 2: 0.0443990 (-3.4%)
الهدف 3: 0.0434685 (-5.4%)
وقف الخسارة: 0.0471908 (+2.7%)
الخطة: ادخل فقط ضمن النطاق، وجنِ نصف الأرباح عند الهدف 1، ثم انقل وقف الخسارة إلى سعر الدخول.
لماذا البيع على المكشوف؟ قائمة تحقق BTR: تتفق 7/12 إشارة، وتعارضها إشارتان، و3 غير حاسمة
• الاتجاه اليومي: السعر < EMA50 < EMA200، ترتيب هبوطي → الاتجاه العام هابط
• اتجاه 4 ساعات: السعر < EMA50 < EMA200، ترتيب هبوطي → اتجاه التأرجح هابط
• اتجاه ساعة واحدة: السعر < EMA50 < EMA200، ترتيب هبوطي → الاتجاه قصير الأجل هابط
تنبيه: المسافة عن EMA50 على إطار الساعة: −4.1 ATR عن EMA50 على إطار الساعة، تشبّع مفرط مع خطر الارتداد → هبط السعر كثيرًا دون متوسطه، ومن المرجح حدوث ارتداد
تنبيه: تصبح الفكرة خاطئة إذا بلغ السعر وقف الخسارة عند 0.0471908
الخلاصة: يشكل ترتيب الاتجاه الهبوطي اليومي أقوى دعم، بينما يحذر خطر الارتداد على إطار الساعة بسبب تشبّع مؤشر RSI بالبيع من الدخول في هذه الصفقة.
لو كنت عند مستوى الدخول، هل ستظل تبيع على المكشوف أم تنتظر ارتدادًا؟
المستويات محددة على الرسم البياني أدناه.
📲 أتريد المزيد من أحدث إشاراتي؟ انضم إليّ هنا:
https://app.binance.com/uni-qr/D26WbL9t
⚠️ هذا تحليل شخصي للسوق فقط. لا تُعد هذه توصية مالية — أدر المخاطر وأجرِ أبحاثك الخاصة.
محتوى تعليمي، وليس نصيحة استثمارية أو توصية بشراء أي أصل أو بيعه أو إيداعه أو سحبه. لا يوجد ترويج مدفوع أو روابط إحالة/شراكة.
🔴 بيع على المكشوف $BTR /USDT: نتوقع أن يهبط السعر
التوجه: بيع على المكشوف · قوي
الدخول: 0.0458915 – 0.0460085
الهدف 1: 0.0450194 (-2.0%)
الهدف 2: 0.0443990 (-3.4%)
الهدف 3: 0.0434685 (-5.4%)
وقف الخسارة: 0.0471908 (+2.7%)
الخطة: ادخل فقط ضمن النطاق، وجنِ نصف الأرباح عند الهدف 1، ثم انقل وقف الخسارة إلى سعر الدخول.
لماذا البيع على المكشوف؟ قائمة تحقق BTR: تتفق 7/12 إشارة، وتعارضها إشارتان، و3 غير حاسمة
• الاتجاه اليومي: السعر < EMA50 < EMA200، ترتيب هبوطي → الاتجاه العام هابط
• اتجاه 4 ساعات: السعر < EMA50 < EMA200، ترتيب هبوطي → اتجاه التأرجح هابط
• اتجاه ساعة واحدة: السعر < EMA50 < EMA200، ترتيب هبوطي → الاتجاه قصير الأجل هابط
تنبيه: المسافة عن EMA50 على إطار الساعة: −4.1 ATR عن EMA50 على إطار الساعة، تشبّع مفرط مع خطر الارتداد → هبط السعر كثيرًا دون متوسطه، ومن المرجح حدوث ارتداد
تنبيه: تصبح الفكرة خاطئة إذا بلغ السعر وقف الخسارة عند 0.0471908
الخلاصة: يشكل ترتيب الاتجاه الهبوطي اليومي أقوى دعم، بينما يحذر خطر الارتداد على إطار الساعة بسبب تشبّع مؤشر RSI بالبيع من الدخول في هذه الصفقة.
لو كنت عند مستوى الدخول، هل ستظل تبيع على المكشوف أم تنتظر ارتدادًا؟
المستويات محددة على الرسم البياني أدناه.
📲 أتريد المزيد من أحدث إشاراتي؟ انضم إليّ هنا:
https://app.binance.com/uni-qr/D26WbL9t
⚠️ هذا تحليل شخصي للسوق فقط. لا تُعد هذه توصية مالية — أدر المخاطر وأجرِ أبحاثك الخاصة.
محتوى تعليمي، وليس نصيحة استثمارية أو توصية بشراء أي أصل أو بيعه أو إيداعه أو سحبه. لا يوجد ترويج مدفوع أو روابط إحالة/شراكة.
1
506
·
--
صاعد
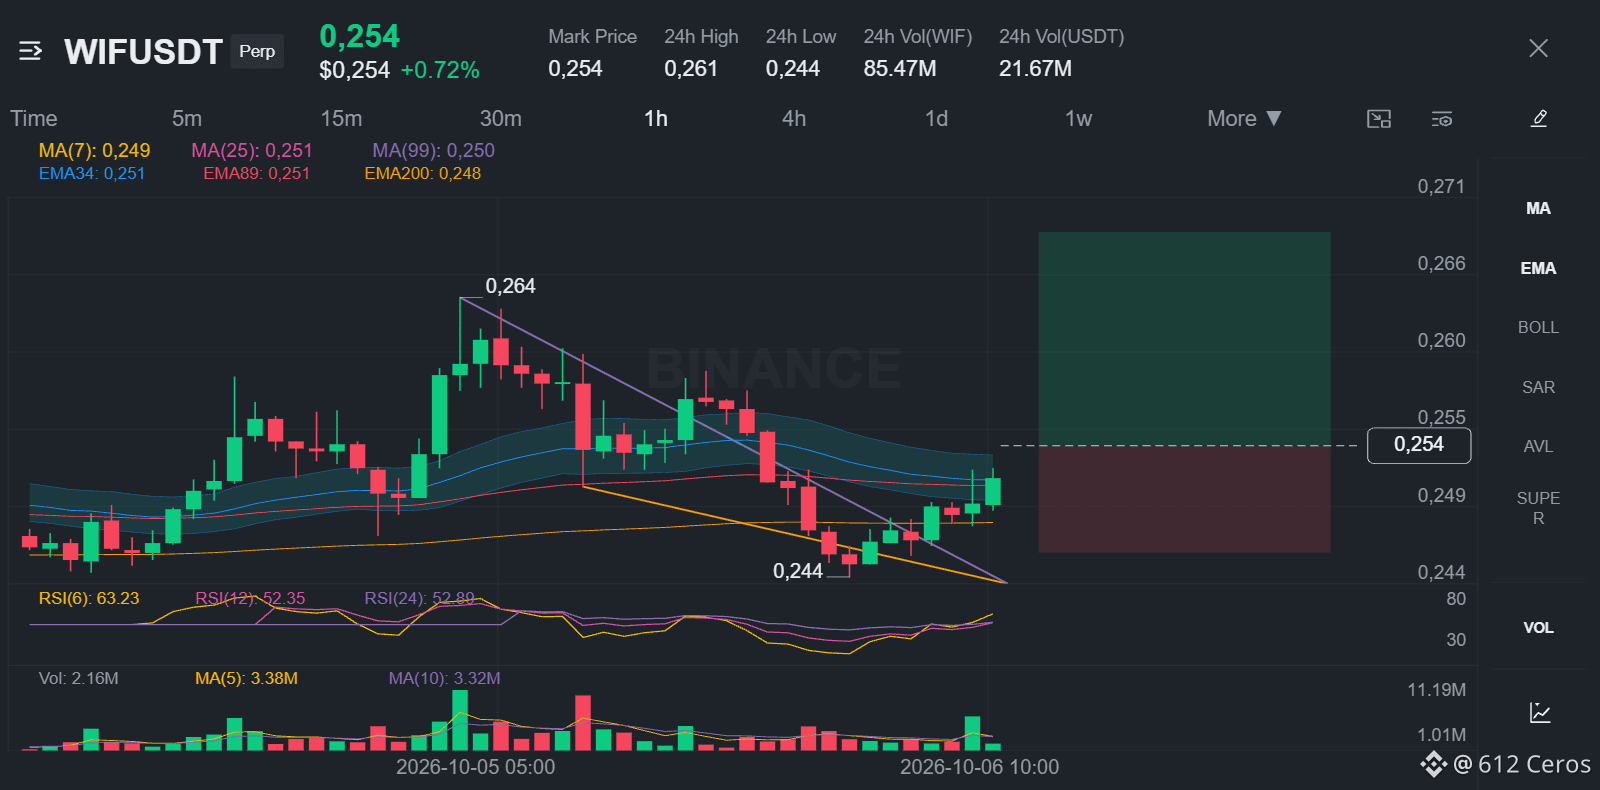
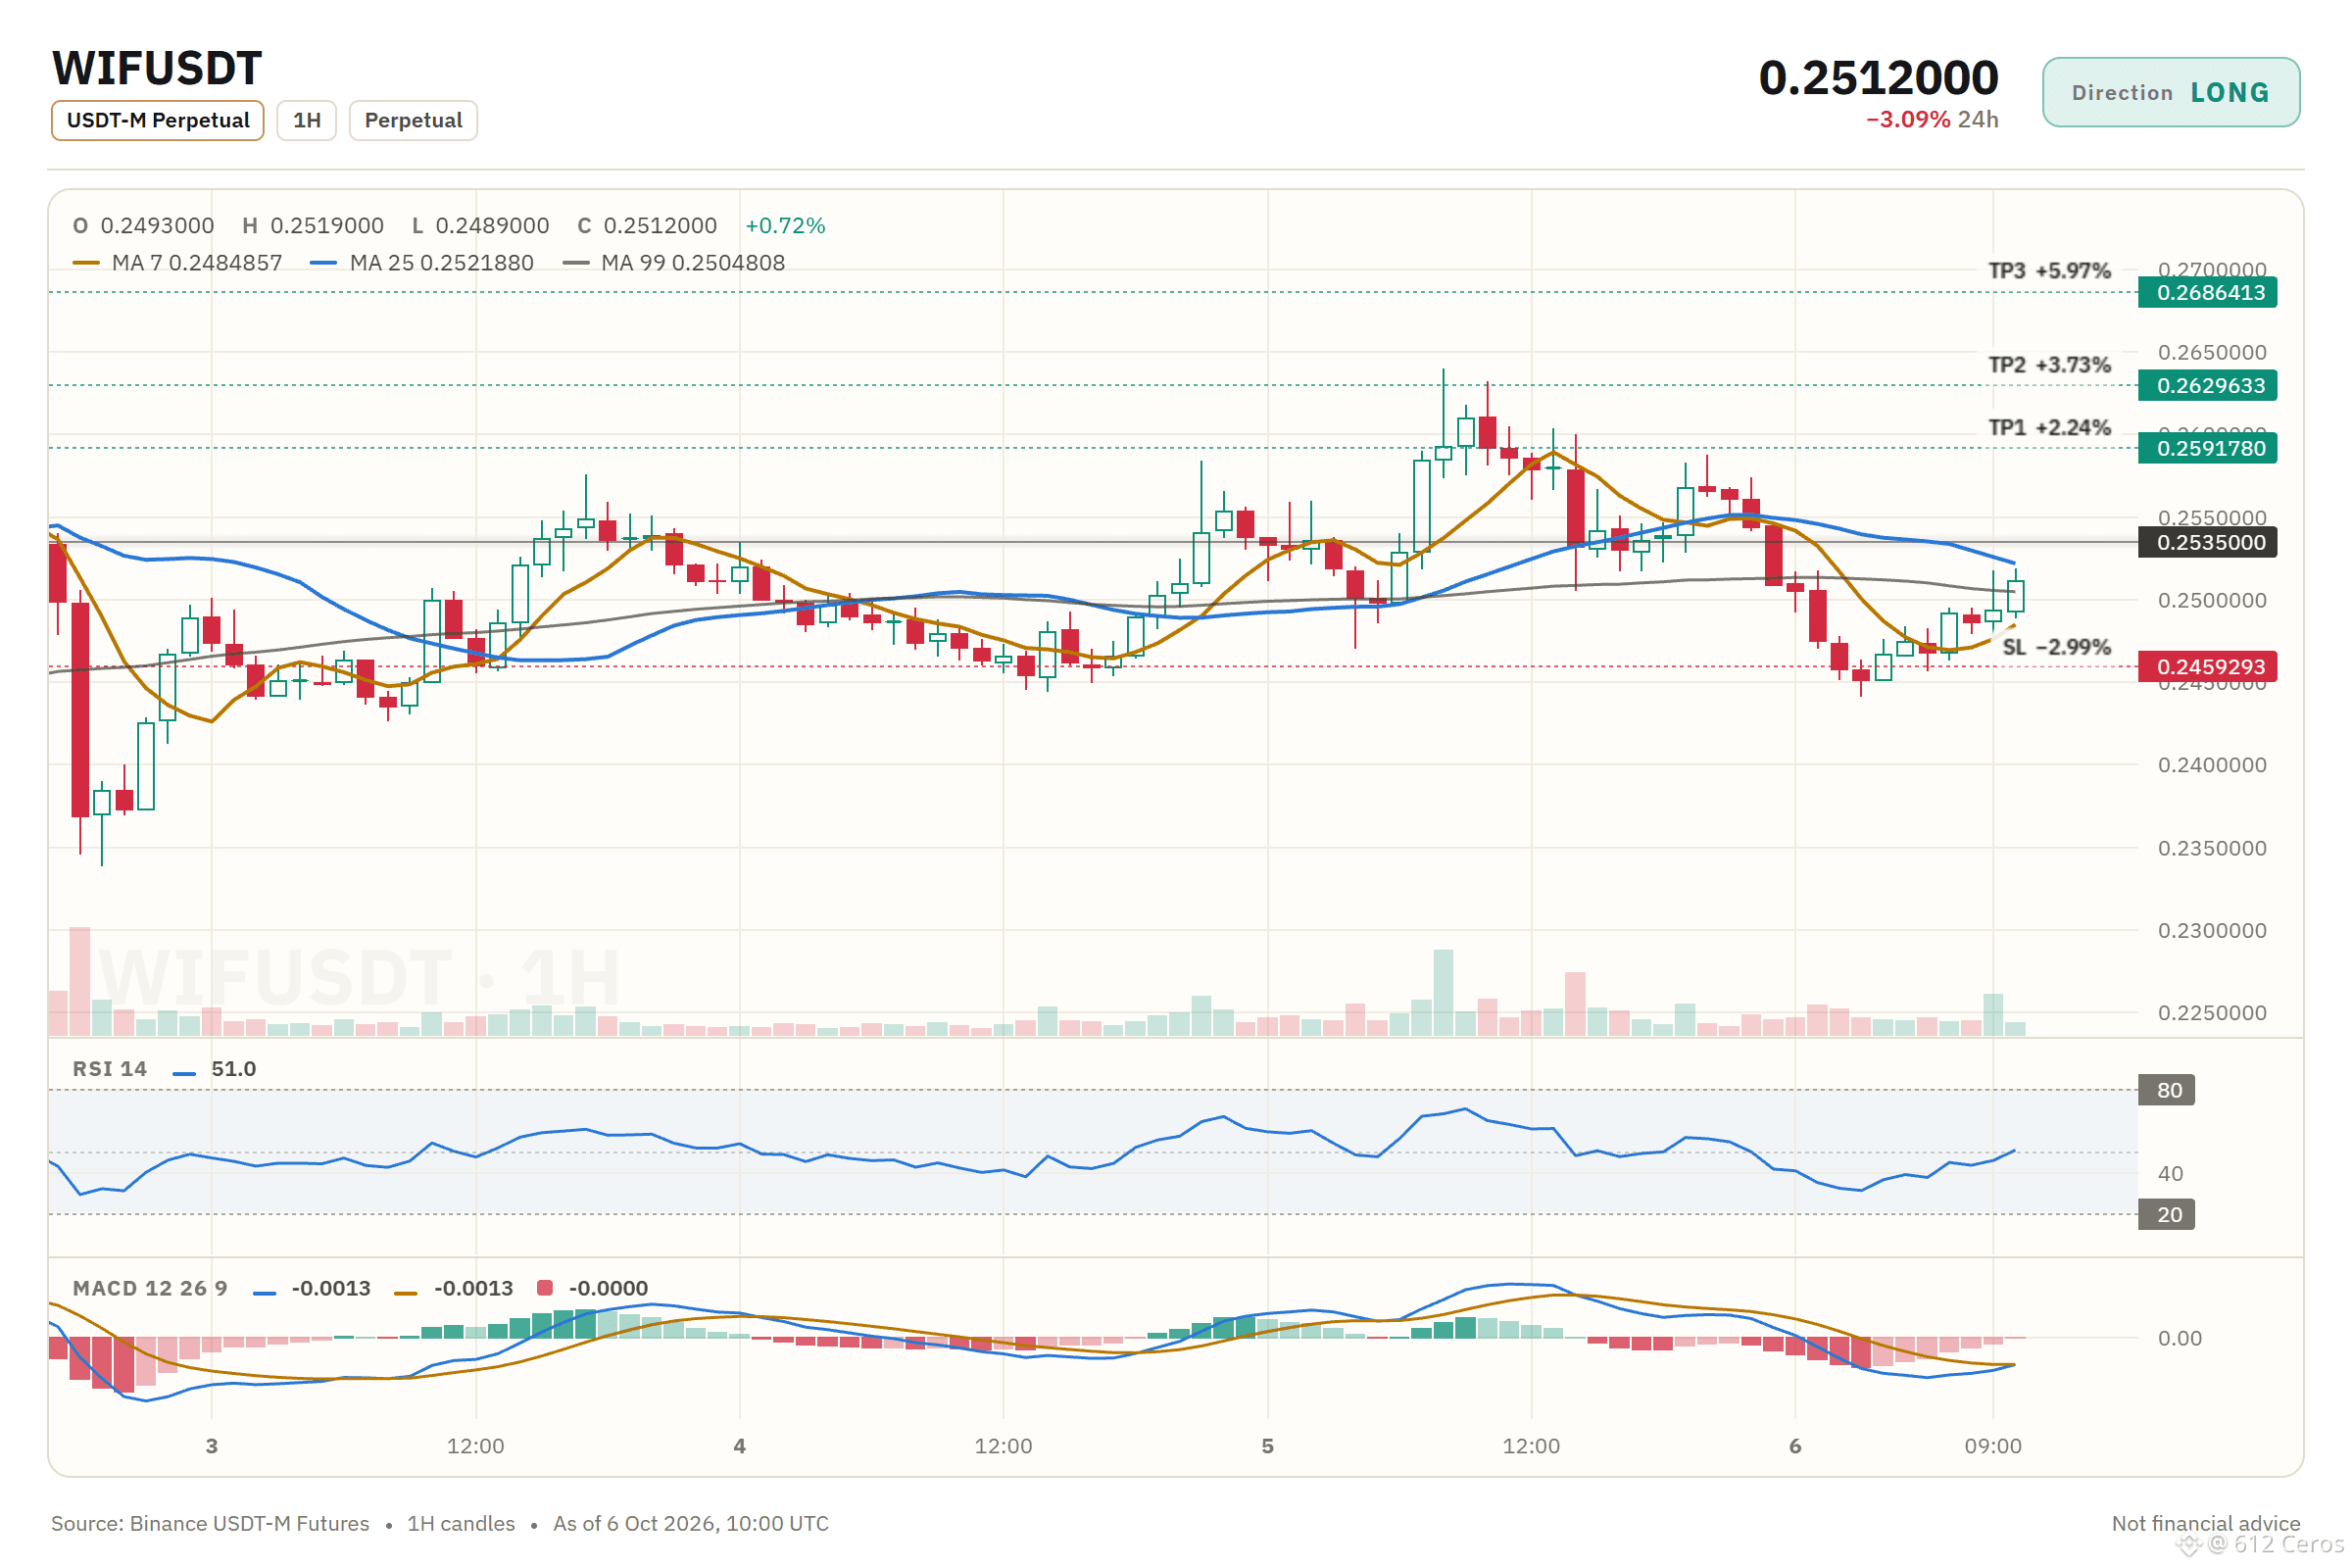
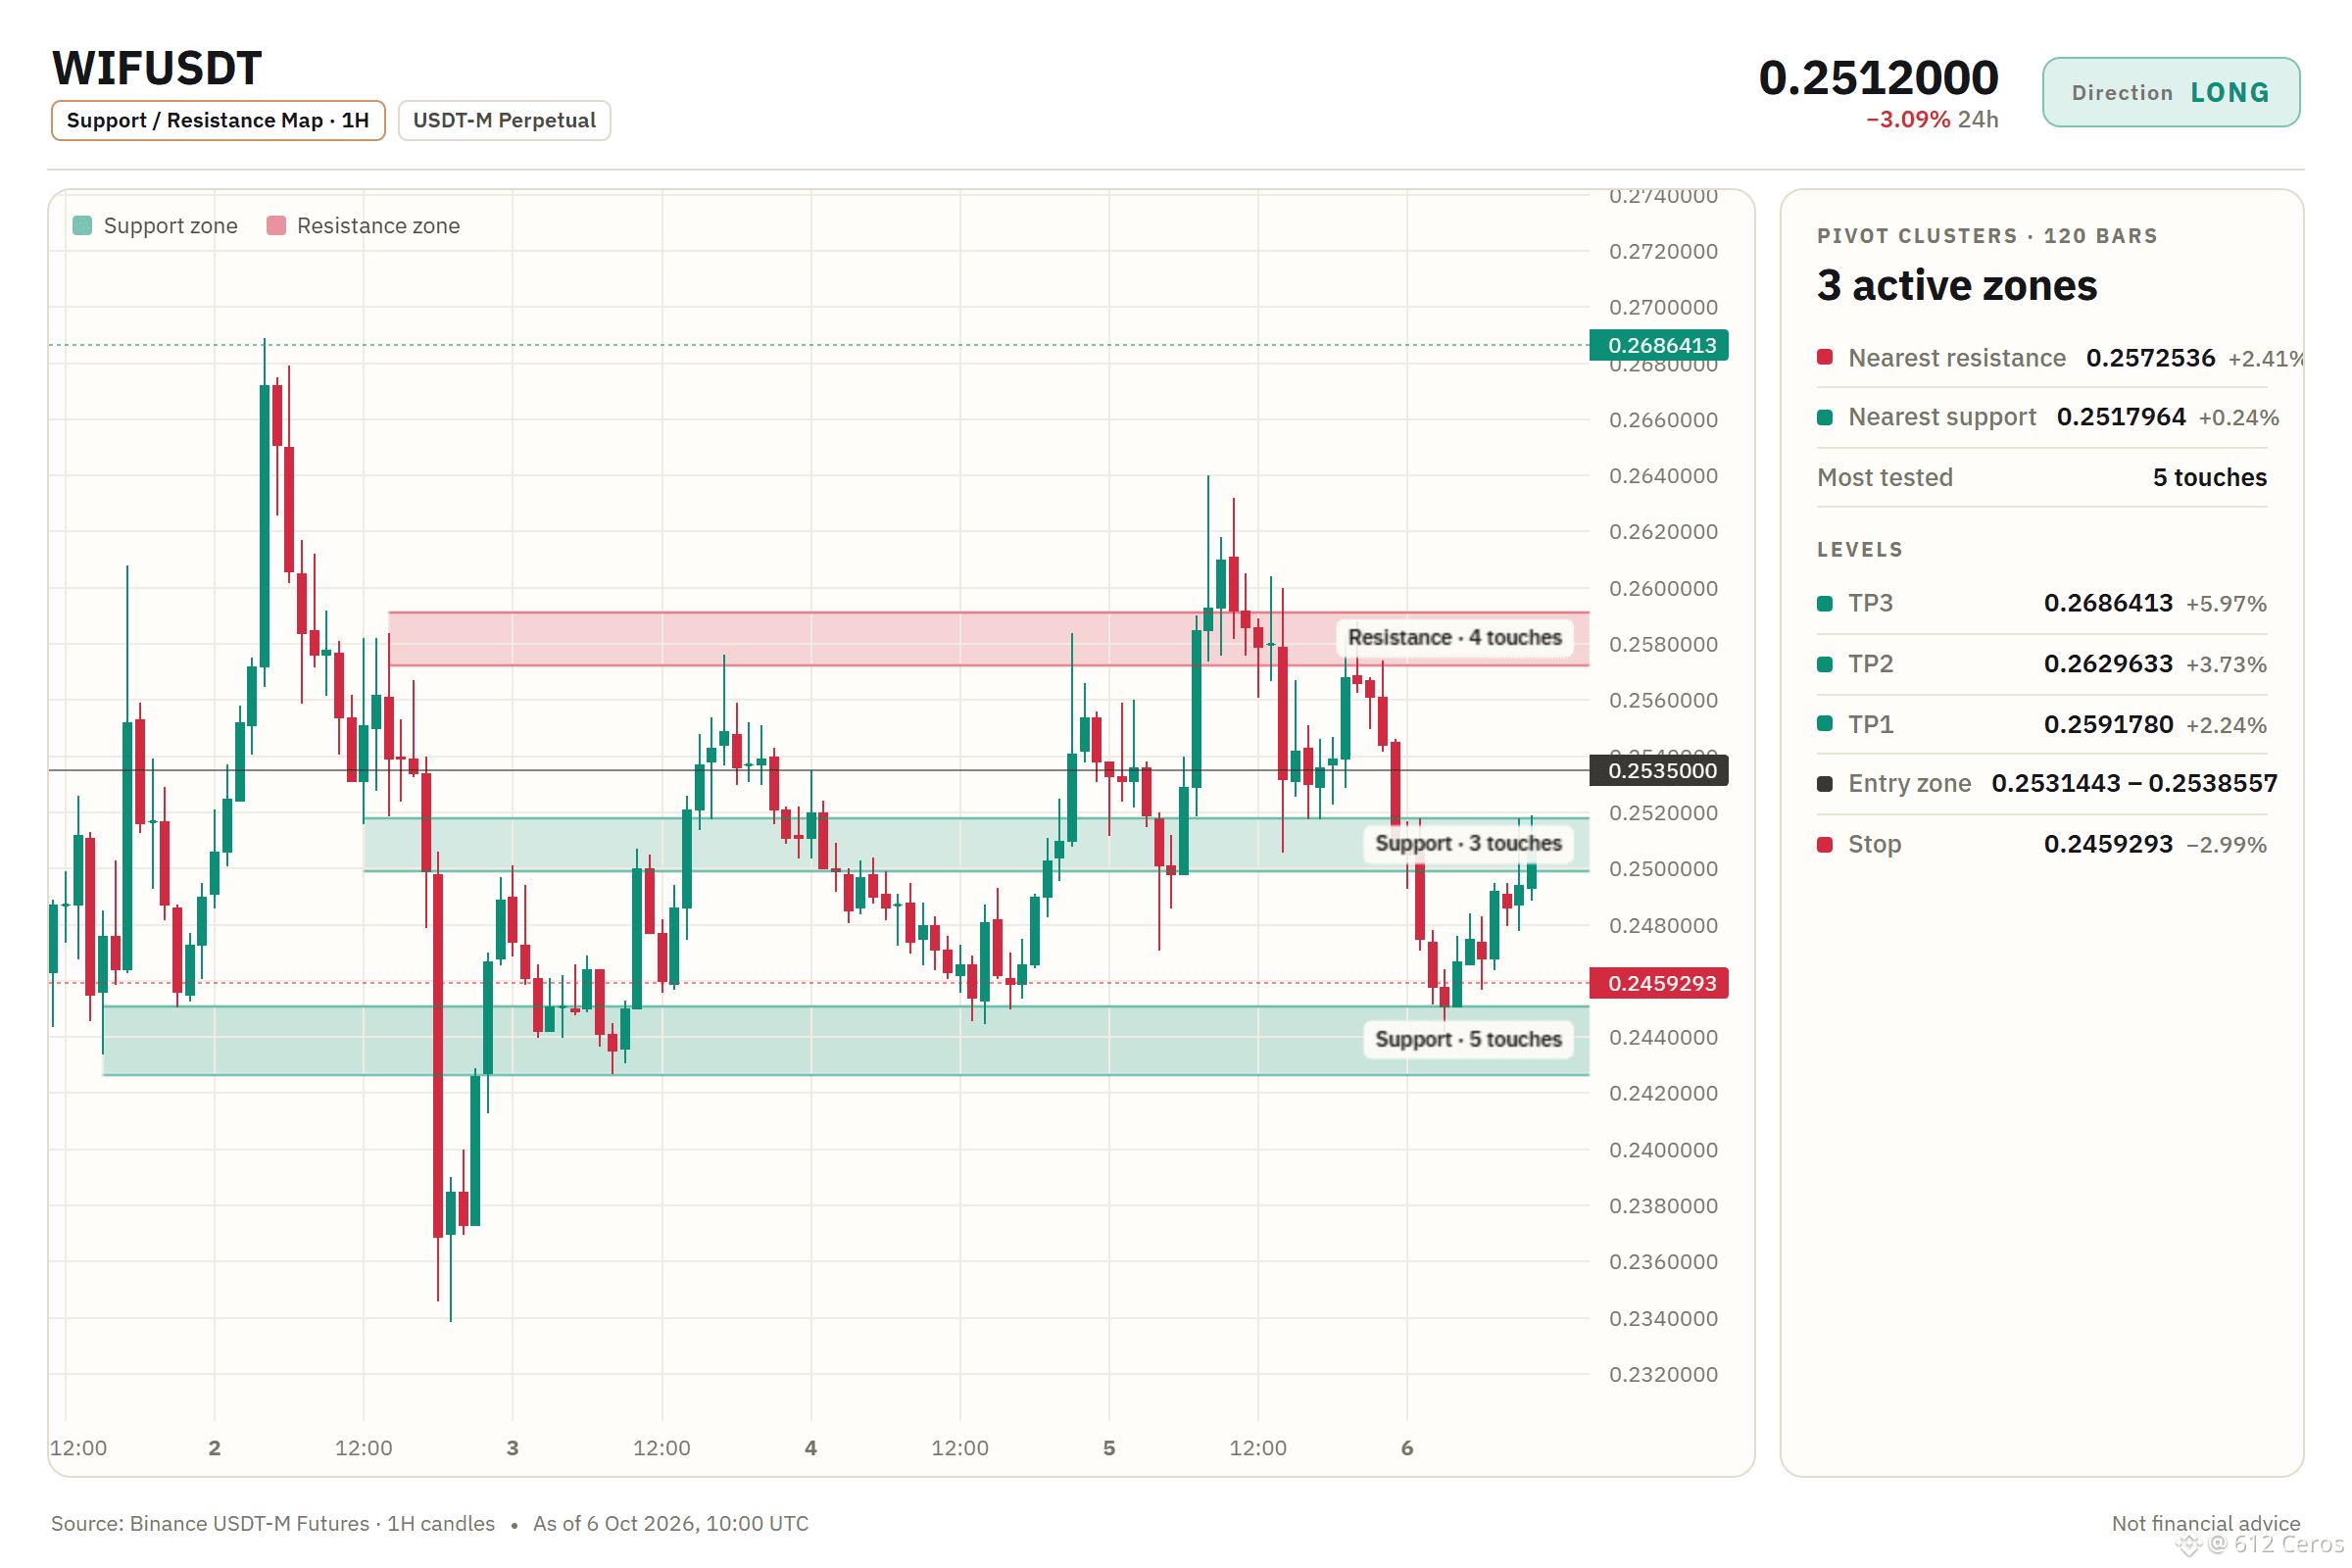
يحافظ WIF على ترتيب يومي صعودي، بينما يظل مؤشر RSI على إطار الساعة محايدًا.
🟢 شراء $WIF /USDT: توقع ارتفاع السعر
التوجه: شراء · ميل صعودي
الدخول: 0.2531443 – 0.2538557
جني الأرباح 1: 0.2591780 (+2.2%)
جني الأرباح 2: 0.2629633 (+3.7%)
جني الأرباح 3: 0.2686413 (+6.0%)
وقف الخسارة: 0.2459293 (-3.0%)
الخطة: ادخل فقط ضمن النطاق، وخذ نصف الكمية عند جني الأرباح 1، ثم انقل وقف الخسارة إلى سعر الدخول.
ملاحظة: مستوى الثقة متوسط فحسب، لذا أبقِ حجم الصفقة صغيرًا.
لماذا الشراء؟ التوجه يميل للصعود؛ إذ تتفق 5 من أصل 12 إشارة، وتعارضه إشارة واحدة، فيما لم تحسم 6 إشارات موقفها.
• الاتجاه اليومي: السعر > EMA50 > EMA200، ترتيب صعودي ← الاتجاه العام صاعد
• اتجاه 4 ساعات: السعر > EMA50 > EMA200، ترتيب صعودي ← اتجاه الحركة صاعد
• اتجاه ساعة واحدة: السعر > EMA50 > EMA200، ترتيب صعودي ← الاتجاه قصير الأجل صاعد
المخاطر: القوة النسبية مقابل BTC: أداء أضعف، بنسبة −2.19% مقارنةً بـ BTC خلال اليوم الماضي ← أضعف من BTC
ملخص WIF في 3 نقاط:
1. الاتجاه اليومي صعودي، والسعر أعلى من EMA50 وEMA200.
2. الاتجاه على إطار الساعة صعودي، والسعر أعلى من EMA50 وEMA200.
3. الإغلاق اليومي دون 0.2459293 سيُبطل الإعداد ويفعّل وقف الخسارة.
أين ستضع وقف الخسارة إذا دخلت صفقة الشراء هذه؟
الرسم البياني مع جميع المستويات أدناه.
{future}(WIFUSDT)
📲 هل تريد المزيد من أحدث إشاراتي؟ انضم إليّ هنا:
[https://app.binance.com/uni-qr/D26WbL9t](https://app.binance.com/uni-qr/D26WbL9t)
⚠️ هذا تحليل شخصي للسوق فقط. ليس نصيحة مالية — أدر المخاطر بنفسك وأجرِ بحثك الخاص.
محتوى تعليمي، وليس نصيحة استثمارية أو توصية بشراء أي أصل أو بيعه أو إيداعه أو سحبه. لا يوجد ترويج مدفوع أو روابط إحالة/تسويق بالعمولة.
يحافظ WIF على ترتيب يومي صعودي، بينما يظل مؤشر RSI على إطار الساعة محايدًا.
🟢 شراء $WIF /USDT: توقع ارتفاع السعر
التوجه: شراء · ميل صعودي
الدخول: 0.2531443 – 0.2538557
جني الأرباح 1: 0.2591780 (+2.2%)
جني الأرباح 2: 0.2629633 (+3.7%)
جني الأرباح 3: 0.2686413 (+6.0%)
وقف الخسارة: 0.2459293 (-3.0%)
الخطة: ادخل فقط ضمن النطاق، وخذ نصف الكمية عند جني الأرباح 1، ثم انقل وقف الخسارة إلى سعر الدخول.
ملاحظة: مستوى الثقة متوسط فحسب، لذا أبقِ حجم الصفقة صغيرًا.
لماذا الشراء؟ التوجه يميل للصعود؛ إذ تتفق 5 من أصل 12 إشارة، وتعارضه إشارة واحدة، فيما لم تحسم 6 إشارات موقفها.
• الاتجاه اليومي: السعر > EMA50 > EMA200، ترتيب صعودي ← الاتجاه العام صاعد
• اتجاه 4 ساعات: السعر > EMA50 > EMA200، ترتيب صعودي ← اتجاه الحركة صاعد
• اتجاه ساعة واحدة: السعر > EMA50 > EMA200، ترتيب صعودي ← الاتجاه قصير الأجل صاعد
المخاطر: القوة النسبية مقابل BTC: أداء أضعف، بنسبة −2.19% مقارنةً بـ BTC خلال اليوم الماضي ← أضعف من BTC
ملخص WIF في 3 نقاط:
1. الاتجاه اليومي صعودي، والسعر أعلى من EMA50 وEMA200.
2. الاتجاه على إطار الساعة صعودي، والسعر أعلى من EMA50 وEMA200.
3. الإغلاق اليومي دون 0.2459293 سيُبطل الإعداد ويفعّل وقف الخسارة.
أين ستضع وقف الخسارة إذا دخلت صفقة الشراء هذه؟
الرسم البياني مع جميع المستويات أدناه.
📲 هل تريد المزيد من أحدث إشاراتي؟ انضم إليّ هنا:
https://app.binance.com/uni-qr/D26WbL9t
⚠️ هذا تحليل شخصي للسوق فقط. ليس نصيحة مالية — أدر المخاطر بنفسك وأجرِ بحثك الخاص.
محتوى تعليمي، وليس نصيحة استثمارية أو توصية بشراء أي أصل أو بيعه أو إيداعه أو سحبه. لا يوجد ترويج مدفوع أو روابط إحالة/تسويق بالعمولة.
🟢 شراء $WIF /USDT: توقع ارتفاع السعر
التوجه: شراء · ميل صعودي
الدخول: 0.2531443 – 0.2538557
جني الأرباح 1: 0.2591780 (+2.2%)
جني الأرباح 2: 0.2629633 (+3.7%)
جني الأرباح 3: 0.2686413 (+6.0%)
وقف الخسارة: 0.2459293 (-3.0%)
الخطة: ادخل فقط ضمن النطاق، وخذ نصف الكمية عند جني الأرباح 1، ثم انقل وقف الخسارة إلى سعر الدخول.
ملاحظة: مستوى الثقة متوسط فحسب، لذا أبقِ حجم الصفقة صغيرًا.
لماذا الشراء؟ التوجه يميل للصعود؛ إذ تتفق 5 من أصل 12 إشارة، وتعارضه إشارة واحدة، فيما لم تحسم 6 إشارات موقفها.
• الاتجاه اليومي: السعر > EMA50 > EMA200، ترتيب صعودي ← الاتجاه العام صاعد
• اتجاه 4 ساعات: السعر > EMA50 > EMA200، ترتيب صعودي ← اتجاه الحركة صاعد
• اتجاه ساعة واحدة: السعر > EMA50 > EMA200، ترتيب صعودي ← الاتجاه قصير الأجل صاعد
المخاطر: القوة النسبية مقابل BTC: أداء أضعف، بنسبة −2.19% مقارنةً بـ BTC خلال اليوم الماضي ← أضعف من BTC
ملخص WIF في 3 نقاط:
1. الاتجاه اليومي صعودي، والسعر أعلى من EMA50 وEMA200.
2. الاتجاه على إطار الساعة صعودي، والسعر أعلى من EMA50 وEMA200.
3. الإغلاق اليومي دون 0.2459293 سيُبطل الإعداد ويفعّل وقف الخسارة.
أين ستضع وقف الخسارة إذا دخلت صفقة الشراء هذه؟
الرسم البياني مع جميع المستويات أدناه.
📲 هل تريد المزيد من أحدث إشاراتي؟ انضم إليّ هنا:
https://app.binance.com/uni-qr/D26WbL9t
⚠️ هذا تحليل شخصي للسوق فقط. ليس نصيحة مالية — أدر المخاطر بنفسك وأجرِ بحثك الخاص.
محتوى تعليمي، وليس نصيحة استثمارية أو توصية بشراء أي أصل أو بيعه أو إيداعه أو سحبه. لا يوجد ترويج مدفوع أو روابط إحالة/تسويق بالعمولة.
1
381
·
--
صاعد
متداولو XRP أصحاب المراكز الشرائية يتجاهلون تباين الاتجاه على المدى القصير.
🟢 شراء $XRP /USDT: توقع ارتفاع السعر
التحيز: شراء · ميل للشراء
الدخول: 1.5106 – 1.5128
TP1: 1.5278 (+1.1%)
TP2: 1.5386 (+1.8%)
TP3: 1.5547 (+2.8%)
وقف الخسارة: 1.4902 (-1.4%)
الخطة: ادخل ضمن النطاق فقط، وخذ نصف الكمية عند TP1، ثم انقل وقف الخسارة إلى سعر الدخول.
ملاحظة: مستوى الثقة متوسط فقط، لذا أبقِ حجم الصفقة صغيرًا.
لماذا الشراء؟ التوصية تميل إلى الشراء؛ 5 من أصل 12 إشارة متوافقة، و0 معارضة، و7 غير حاسمة.
• الاتجاه اليومي: السعر > EMA50 > EMA200، ترتيب صعودي ← الاتجاه العام صاعد
• اتجاه 4 ساعات: السعر > EMA50 > EMA200، ترتيب صعودي ← اتجاه التأرجح صاعد
• وضع BTC: اتجاه BTC صعودي والارتباط 0.79 ← يرتفع BTC وتميل هذه العملة إلى اتباعه
الأسباب:
الاتجاه اليومي صعودي، واتجاه 4 ساعات صعودي، لذا يشير كلا الإطارين الزمنيين الأكبر إلى الصعود. سعر إطار الساعة أعلى من متوسطه المتحرك الأسي، لكن المتوسطات الأسية ليست مرتبة، لذا فإن الاتجاه قصير المدى متباين. يبلغ مؤشر RSI على مخطط 15 دقيقة 62.72، ما يشير إلى أن المشترين يضغطون في الوقت الحالي. نطاق الدخول من 1.5106 إلى 1.5128، ومستوى إبطال الصفقة عند 1.4902.
أين ستحدد أول مستوى لجني الأرباح إذا دخلت بالقرب من 1.5106؟
الإعداد الكامل موضح في المخطط أدناه.
{future}(XRPUSDT)
📲 هل تريد المزيد من أحدث إشاراتي؟ انضم إليّ هنا:
[https://app.binance.com/uni-qr/D26WbL9t](https://app.binance.com/uni-qr/D26WbL9t)
⚠️ تحليل شخصي للسوق فقط. لا تُعد هذه نصيحة مالية — أدر المخاطر بنفسك وأجرِ بحثك الخاص.
محتوى تعليمي، وليس نصيحة استثمارية أو توصية بشراء أي أصل أو بيعه أو إيداعه أو سحبه. لا توجد إعلانات مدفوعة أو روابط إحالة/تسويق بالعمولة.
متداولو XRP أصحاب المراكز الشرائية يتجاهلون تباين الاتجاه على المدى القصير.
🟢 شراء $XRP /USDT: توقع ارتفاع السعر
التحيز: شراء · ميل للشراء
الدخول: 1.5106 – 1.5128
TP1: 1.5278 (+1.1%)
TP2: 1.5386 (+1.8%)
TP3: 1.5547 (+2.8%)
وقف الخسارة: 1.4902 (-1.4%)
الخطة: ادخل ضمن النطاق فقط، وخذ نصف الكمية عند TP1، ثم انقل وقف الخسارة إلى سعر الدخول.
ملاحظة: مستوى الثقة متوسط فقط، لذا أبقِ حجم الصفقة صغيرًا.
لماذا الشراء؟ التوصية تميل إلى الشراء؛ 5 من أصل 12 إشارة متوافقة، و0 معارضة، و7 غير حاسمة.
• الاتجاه اليومي: السعر > EMA50 > EMA200، ترتيب صعودي ← الاتجاه العام صاعد
• اتجاه 4 ساعات: السعر > EMA50 > EMA200، ترتيب صعودي ← اتجاه التأرجح صاعد
• وضع BTC: اتجاه BTC صعودي والارتباط 0.79 ← يرتفع BTC وتميل هذه العملة إلى اتباعه
الأسباب:
الاتجاه اليومي صعودي، واتجاه 4 ساعات صعودي، لذا يشير كلا الإطارين الزمنيين الأكبر إلى الصعود. سعر إطار الساعة أعلى من متوسطه المتحرك الأسي، لكن المتوسطات الأسية ليست مرتبة، لذا فإن الاتجاه قصير المدى متباين. يبلغ مؤشر RSI على مخطط 15 دقيقة 62.72، ما يشير إلى أن المشترين يضغطون في الوقت الحالي. نطاق الدخول من 1.5106 إلى 1.5128، ومستوى إبطال الصفقة عند 1.4902.
أين ستحدد أول مستوى لجني الأرباح إذا دخلت بالقرب من 1.5106؟
الإعداد الكامل موضح في المخطط أدناه.
📲 هل تريد المزيد من أحدث إشاراتي؟ انضم إليّ هنا:
https://app.binance.com/uni-qr/D26WbL9t
⚠️ تحليل شخصي للسوق فقط. لا تُعد هذه نصيحة مالية — أدر المخاطر بنفسك وأجرِ بحثك الخاص.
محتوى تعليمي، وليس نصيحة استثمارية أو توصية بشراء أي أصل أو بيعه أو إيداعه أو سحبه. لا توجد إعلانات مدفوعة أو روابط إحالة/تسويق بالعمولة.
🟢 شراء $XRP /USDT: توقع ارتفاع السعر
التحيز: شراء · ميل للشراء
الدخول: 1.5106 – 1.5128
TP1: 1.5278 (+1.1%)
TP2: 1.5386 (+1.8%)
TP3: 1.5547 (+2.8%)
وقف الخسارة: 1.4902 (-1.4%)
الخطة: ادخل ضمن النطاق فقط، وخذ نصف الكمية عند TP1، ثم انقل وقف الخسارة إلى سعر الدخول.
ملاحظة: مستوى الثقة متوسط فقط، لذا أبقِ حجم الصفقة صغيرًا.
لماذا الشراء؟ التوصية تميل إلى الشراء؛ 5 من أصل 12 إشارة متوافقة، و0 معارضة، و7 غير حاسمة.
• الاتجاه اليومي: السعر > EMA50 > EMA200، ترتيب صعودي ← الاتجاه العام صاعد
• اتجاه 4 ساعات: السعر > EMA50 > EMA200، ترتيب صعودي ← اتجاه التأرجح صاعد
• وضع BTC: اتجاه BTC صعودي والارتباط 0.79 ← يرتفع BTC وتميل هذه العملة إلى اتباعه
الأسباب:
الاتجاه اليومي صعودي، واتجاه 4 ساعات صعودي، لذا يشير كلا الإطارين الزمنيين الأكبر إلى الصعود. سعر إطار الساعة أعلى من متوسطه المتحرك الأسي، لكن المتوسطات الأسية ليست مرتبة، لذا فإن الاتجاه قصير المدى متباين. يبلغ مؤشر RSI على مخطط 15 دقيقة 62.72، ما يشير إلى أن المشترين يضغطون في الوقت الحالي. نطاق الدخول من 1.5106 إلى 1.5128، ومستوى إبطال الصفقة عند 1.4902.
أين ستحدد أول مستوى لجني الأرباح إذا دخلت بالقرب من 1.5106؟
الإعداد الكامل موضح في المخطط أدناه.
📲 هل تريد المزيد من أحدث إشاراتي؟ انضم إليّ هنا:
https://app.binance.com/uni-qr/D26WbL9t
⚠️ تحليل شخصي للسوق فقط. لا تُعد هذه نصيحة مالية — أدر المخاطر بنفسك وأجرِ بحثك الخاص.
محتوى تعليمي، وليس نصيحة استثمارية أو توصية بشراء أي أصل أو بيعه أو إيداعه أو سحبه. لا توجد إعلانات مدفوعة أو روابط إحالة/تسويق بالعمولة.
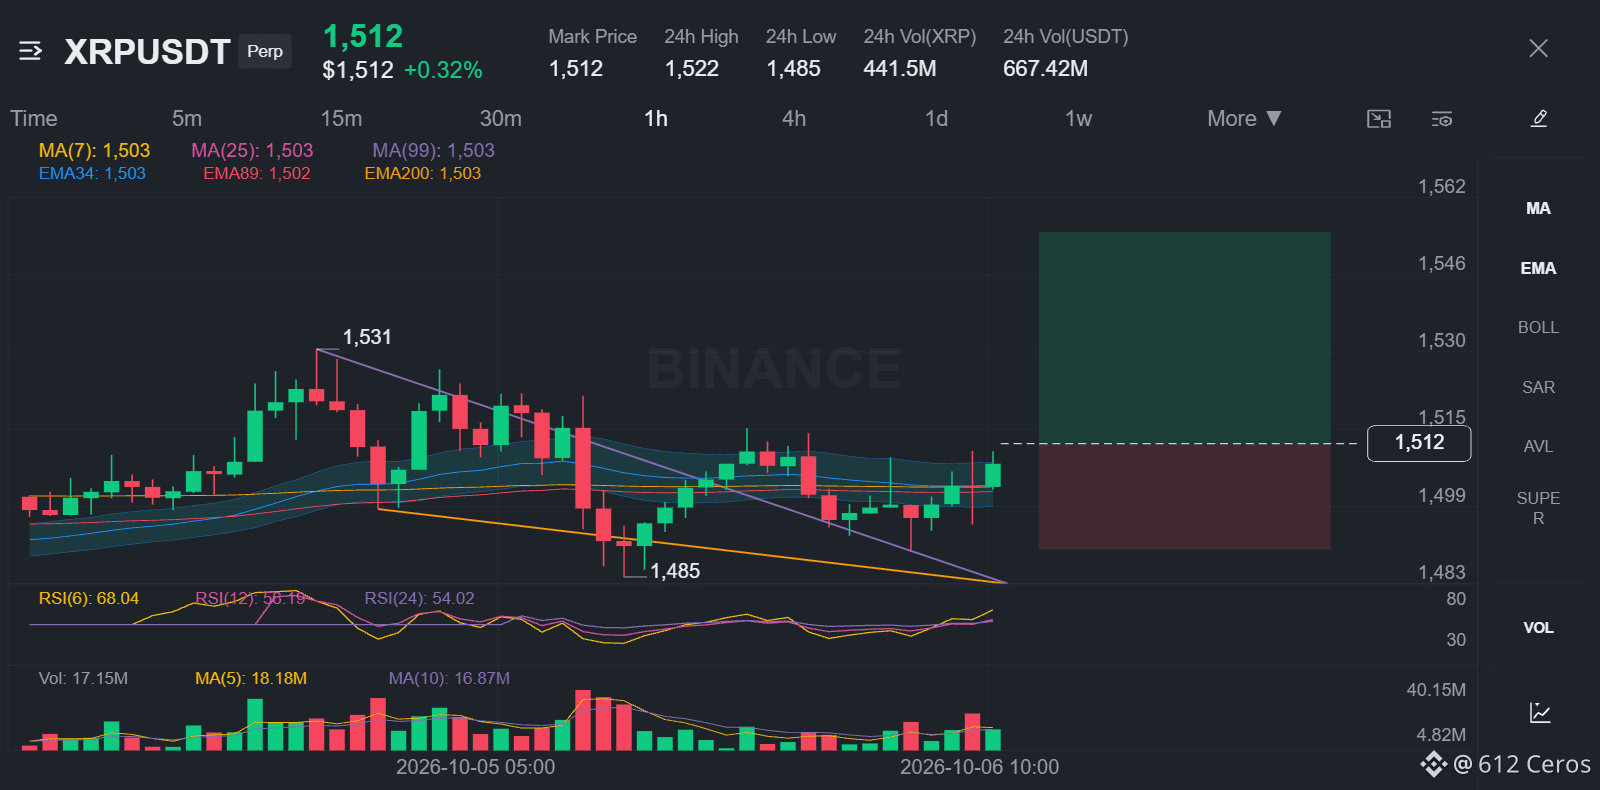
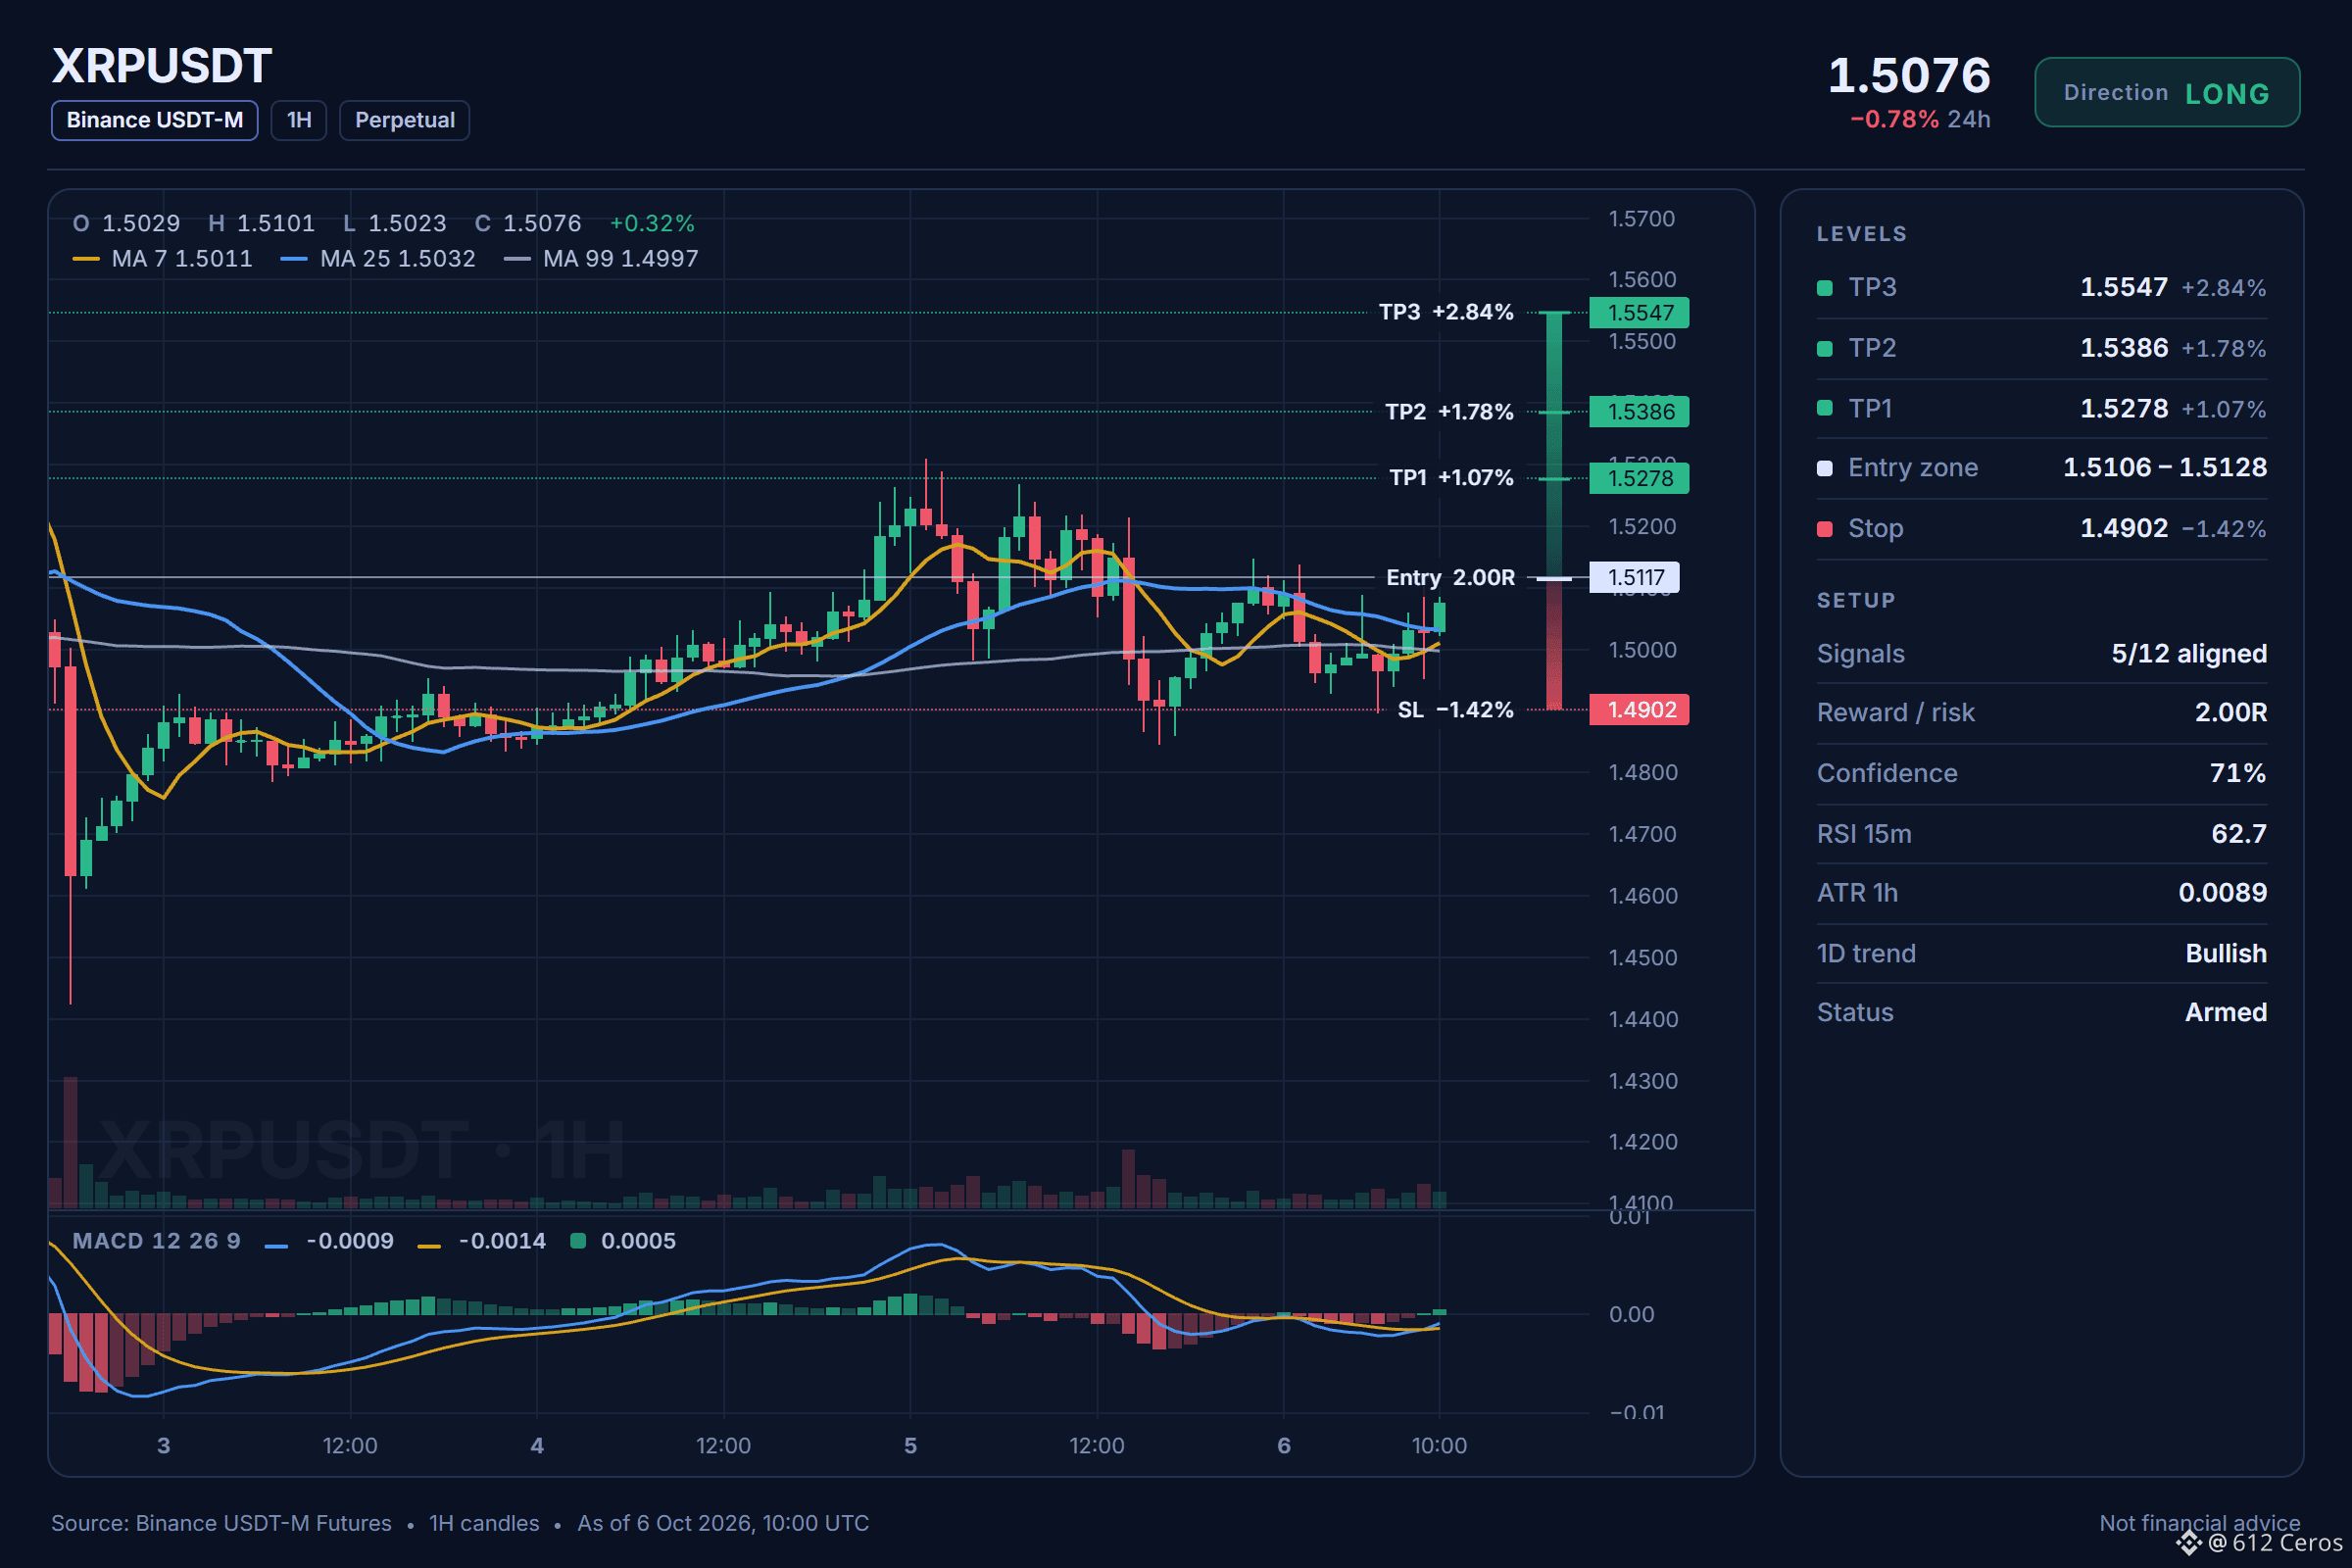
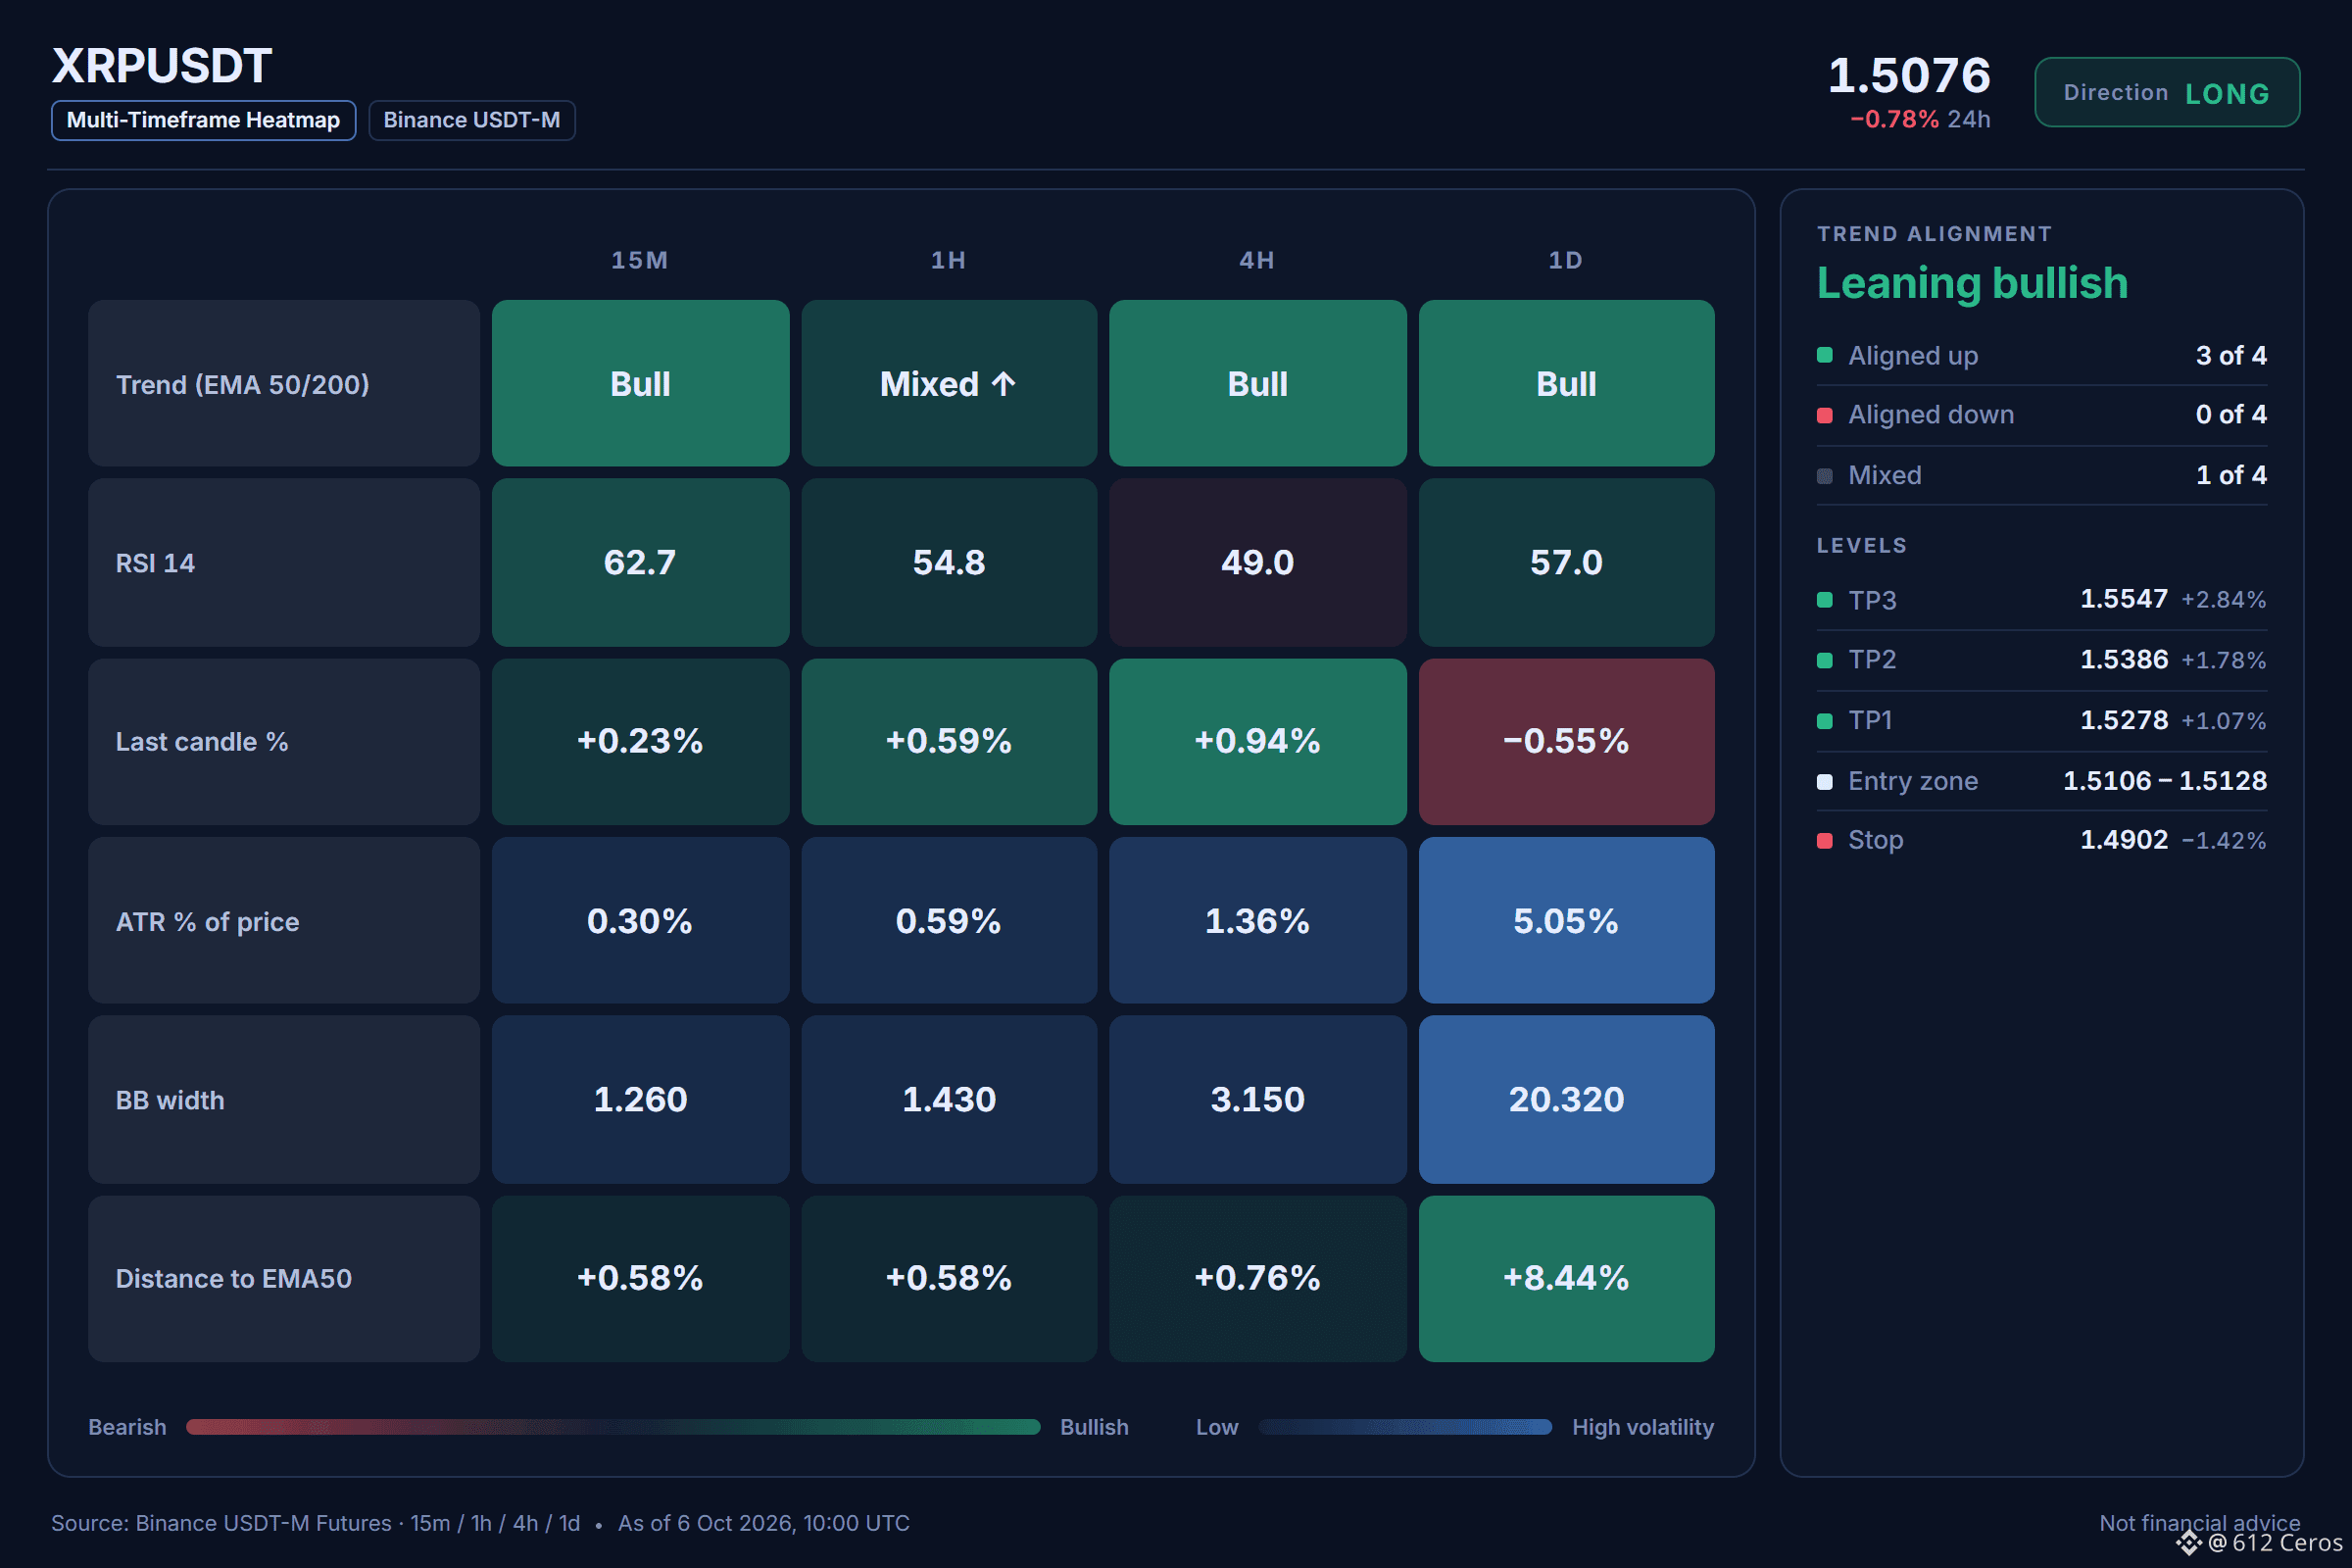
5
559
·
--
صاعد
يتداول سعر BNB فوق مجموعة من المتوسطات المتحركة الأسية.
🟢 شراء (LONG) $BNB /USDT: التوقع أن يرتفع السعر
الاتجاه: شراء (LONG) · ميل صعودي
الدخول: 783.896 – 784.704
الهدف 1: 789.951 (+0.7%)
الهدف 2: 793.719 (+1.2%)
الهدف 3: 799.370 (+1.9%)
وقف الخسارة: 776.765 (-1.0%)
الخطة: ادخل فقط ضمن النطاق، وجنِ نصف الأرباح عند الهدف 1، ثم حرّك وقف الخسارة إلى سعر الدخول.
ملاحظة: مستوى الثقة متوسط فقط، لذا أبقِ حجم الصفقة صغيرًا.
لماذا الشراء؟ التوقع يميل للصعود؛ 4/12 إشارة تؤيده، وإشارة واحدة تعارضه، و7 غير حاسمة.
• الاتجاه اليومي: السعر > EMA50 > EMA200، ترتيب صعودي → الاتجاه العام صاعد
• اتجاه 4 ساعات: السعر > EMA50 > EMA200، ترتيب صعودي → اتجاه التأرجح صاعد
• قوة الاتجاه (ADX/DI، 15 دقيقة): ADX عند 21.9 والمشترون يسيطرون (DI+ 20.3 مقابل DI− 15.0) → المشترون يدفعون الحركة
المخاطر: مؤشر RSI على إطار ساعة: 44.7، زخم هبوطي (أقل من 45) → البائعون هم أصحاب الزخم
إذا تحقق السيناريو:
إذا صمد الترتيب الصعودي على إطار 4 ساعات، فقد يواصل السعر الصعود إلى 789.951 أو أعلى، مواكبًا الاتجاه اليومي الصاعد.
إذا فشل:
إذا هبط RSI على إطار ساعة إلى ما دون 44.7، وتراجع السعر إلى ما دون 776.765، يفشل الإعداد وتخرج من الصفقة.
أين ستضع وقف الخسارة إذا دخلت عند 783.896؟
المستويات محددة على الرسم البياني أدناه.
{future}(BNBUSDT)
📲 هل تريد المزيد من أحدث إشاراتي؟ انضم إليّ هنا:
[https://app.binance.com/uni-qr/D26WbL9t](https://app.binance.com/uni-qr/D26WbL9t)
⚠️ هذا تحليل شخصي للسوق فقط. ليس نصيحة مالية — أدر المخاطر وأجرِ أبحاثك بنفسك.
محتوى تعليمي، وليس نصيحة استثمارية أو توصية بشراء أي أصل أو بيعه أو إيداعه أو سحبه. لا توجد إعلانات مدفوعة أو روابط إحالة/تسويق بالعمولة.
يتداول سعر BNB فوق مجموعة من المتوسطات المتحركة الأسية.
🟢 شراء (LONG) $BNB /USDT: التوقع أن يرتفع السعر
الاتجاه: شراء (LONG) · ميل صعودي
الدخول: 783.896 – 784.704
الهدف 1: 789.951 (+0.7%)
الهدف 2: 793.719 (+1.2%)
الهدف 3: 799.370 (+1.9%)
وقف الخسارة: 776.765 (-1.0%)
الخطة: ادخل فقط ضمن النطاق، وجنِ نصف الأرباح عند الهدف 1، ثم حرّك وقف الخسارة إلى سعر الدخول.
ملاحظة: مستوى الثقة متوسط فقط، لذا أبقِ حجم الصفقة صغيرًا.
لماذا الشراء؟ التوقع يميل للصعود؛ 4/12 إشارة تؤيده، وإشارة واحدة تعارضه، و7 غير حاسمة.
• الاتجاه اليومي: السعر > EMA50 > EMA200، ترتيب صعودي → الاتجاه العام صاعد
• اتجاه 4 ساعات: السعر > EMA50 > EMA200، ترتيب صعودي → اتجاه التأرجح صاعد
• قوة الاتجاه (ADX/DI، 15 دقيقة): ADX عند 21.9 والمشترون يسيطرون (DI+ 20.3 مقابل DI− 15.0) → المشترون يدفعون الحركة
المخاطر: مؤشر RSI على إطار ساعة: 44.7، زخم هبوطي (أقل من 45) → البائعون هم أصحاب الزخم
إذا تحقق السيناريو:
إذا صمد الترتيب الصعودي على إطار 4 ساعات، فقد يواصل السعر الصعود إلى 789.951 أو أعلى، مواكبًا الاتجاه اليومي الصاعد.
إذا فشل:
إذا هبط RSI على إطار ساعة إلى ما دون 44.7، وتراجع السعر إلى ما دون 776.765، يفشل الإعداد وتخرج من الصفقة.
أين ستضع وقف الخسارة إذا دخلت عند 783.896؟
المستويات محددة على الرسم البياني أدناه.
📲 هل تريد المزيد من أحدث إشاراتي؟ انضم إليّ هنا:
https://app.binance.com/uni-qr/D26WbL9t
⚠️ هذا تحليل شخصي للسوق فقط. ليس نصيحة مالية — أدر المخاطر وأجرِ أبحاثك بنفسك.
محتوى تعليمي، وليس نصيحة استثمارية أو توصية بشراء أي أصل أو بيعه أو إيداعه أو سحبه. لا توجد إعلانات مدفوعة أو روابط إحالة/تسويق بالعمولة.
🟢 شراء (LONG) $BNB /USDT: التوقع أن يرتفع السعر
الاتجاه: شراء (LONG) · ميل صعودي
الدخول: 783.896 – 784.704
الهدف 1: 789.951 (+0.7%)
الهدف 2: 793.719 (+1.2%)
الهدف 3: 799.370 (+1.9%)
وقف الخسارة: 776.765 (-1.0%)
الخطة: ادخل فقط ضمن النطاق، وجنِ نصف الأرباح عند الهدف 1، ثم حرّك وقف الخسارة إلى سعر الدخول.
ملاحظة: مستوى الثقة متوسط فقط، لذا أبقِ حجم الصفقة صغيرًا.
لماذا الشراء؟ التوقع يميل للصعود؛ 4/12 إشارة تؤيده، وإشارة واحدة تعارضه، و7 غير حاسمة.
• الاتجاه اليومي: السعر > EMA50 > EMA200، ترتيب صعودي → الاتجاه العام صاعد
• اتجاه 4 ساعات: السعر > EMA50 > EMA200، ترتيب صعودي → اتجاه التأرجح صاعد
• قوة الاتجاه (ADX/DI، 15 دقيقة): ADX عند 21.9 والمشترون يسيطرون (DI+ 20.3 مقابل DI− 15.0) → المشترون يدفعون الحركة
المخاطر: مؤشر RSI على إطار ساعة: 44.7، زخم هبوطي (أقل من 45) → البائعون هم أصحاب الزخم
إذا تحقق السيناريو:
إذا صمد الترتيب الصعودي على إطار 4 ساعات، فقد يواصل السعر الصعود إلى 789.951 أو أعلى، مواكبًا الاتجاه اليومي الصاعد.
إذا فشل:
إذا هبط RSI على إطار ساعة إلى ما دون 44.7، وتراجع السعر إلى ما دون 776.765، يفشل الإعداد وتخرج من الصفقة.
أين ستضع وقف الخسارة إذا دخلت عند 783.896؟
المستويات محددة على الرسم البياني أدناه.
📲 هل تريد المزيد من أحدث إشاراتي؟ انضم إليّ هنا:
https://app.binance.com/uni-qr/D26WbL9t
⚠️ هذا تحليل شخصي للسوق فقط. ليس نصيحة مالية — أدر المخاطر وأجرِ أبحاثك بنفسك.
محتوى تعليمي، وليس نصيحة استثمارية أو توصية بشراء أي أصل أو بيعه أو إيداعه أو سحبه. لا توجد إعلانات مدفوعة أو روابط إحالة/تسويق بالعمولة.
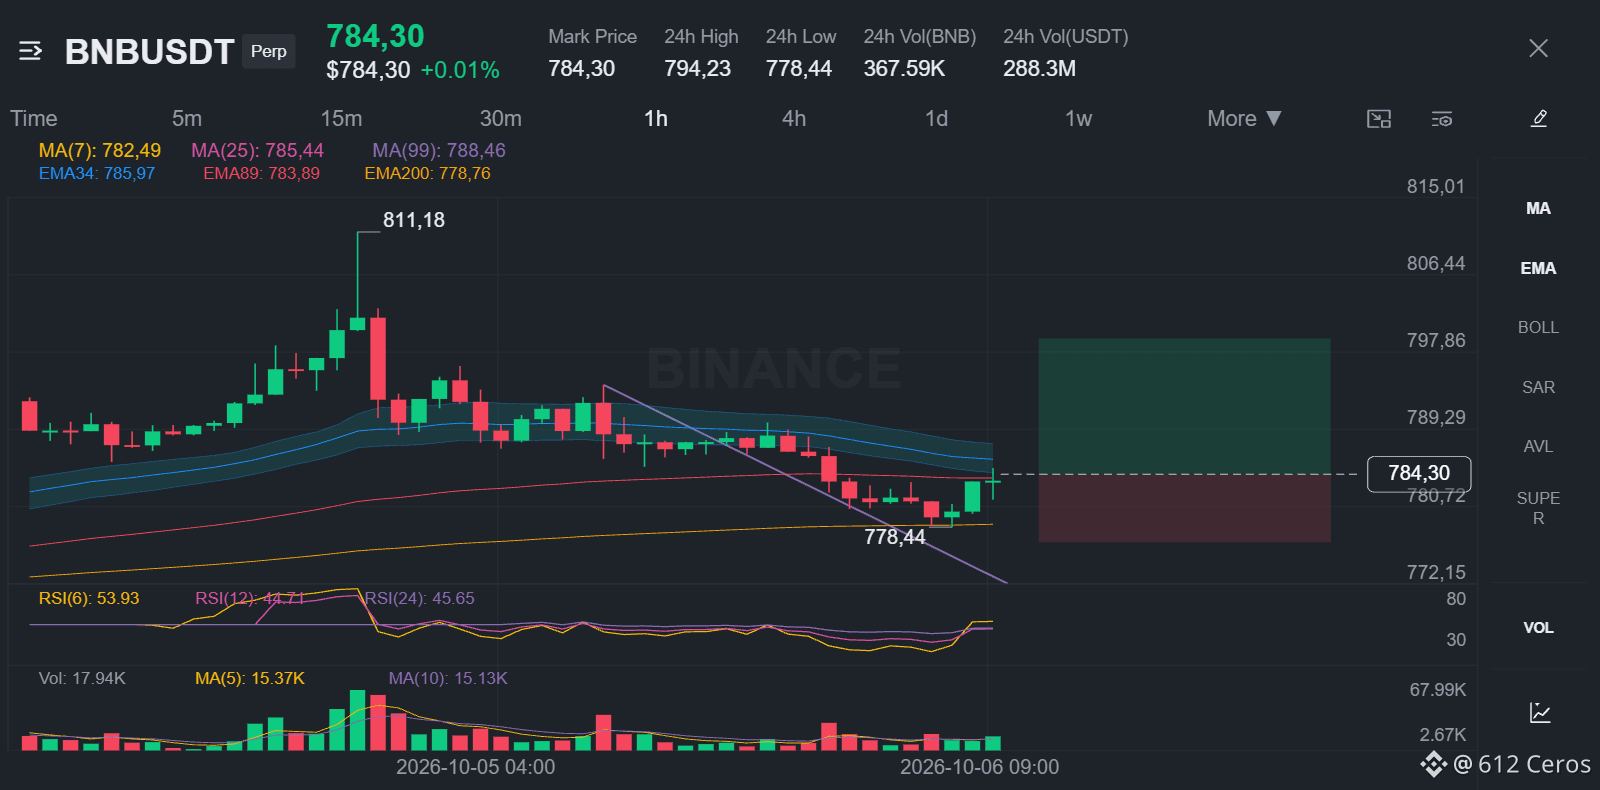
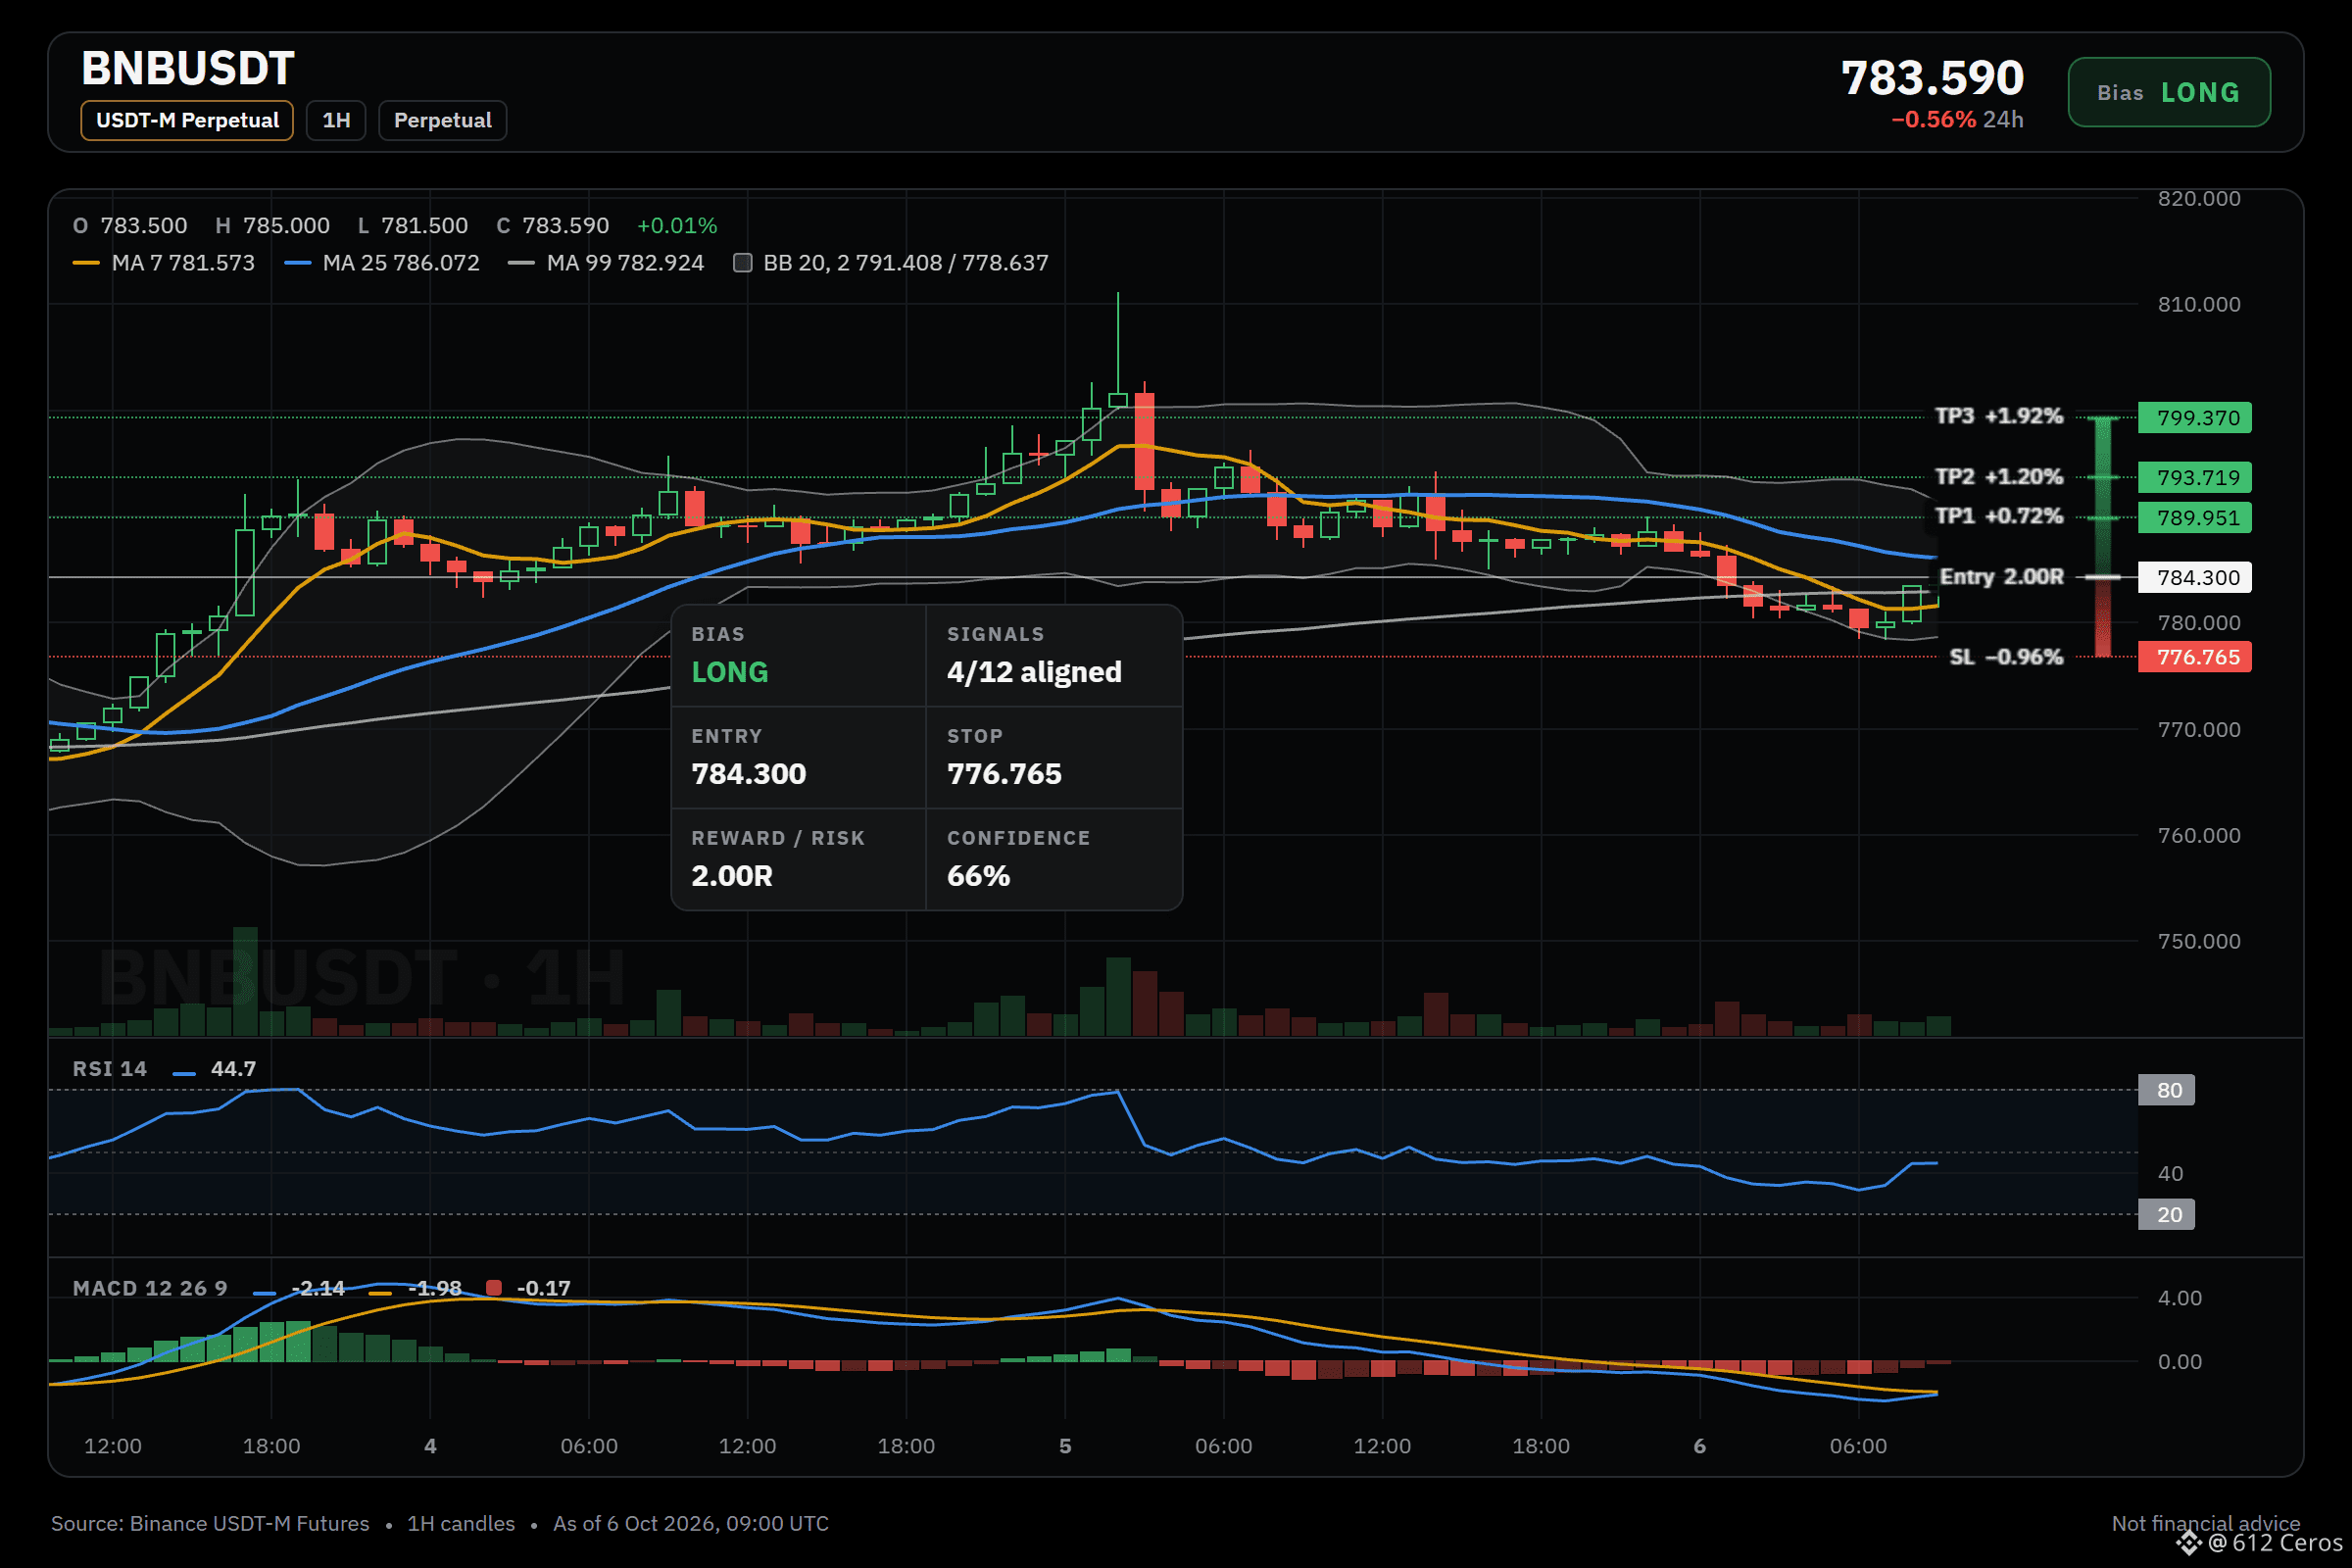
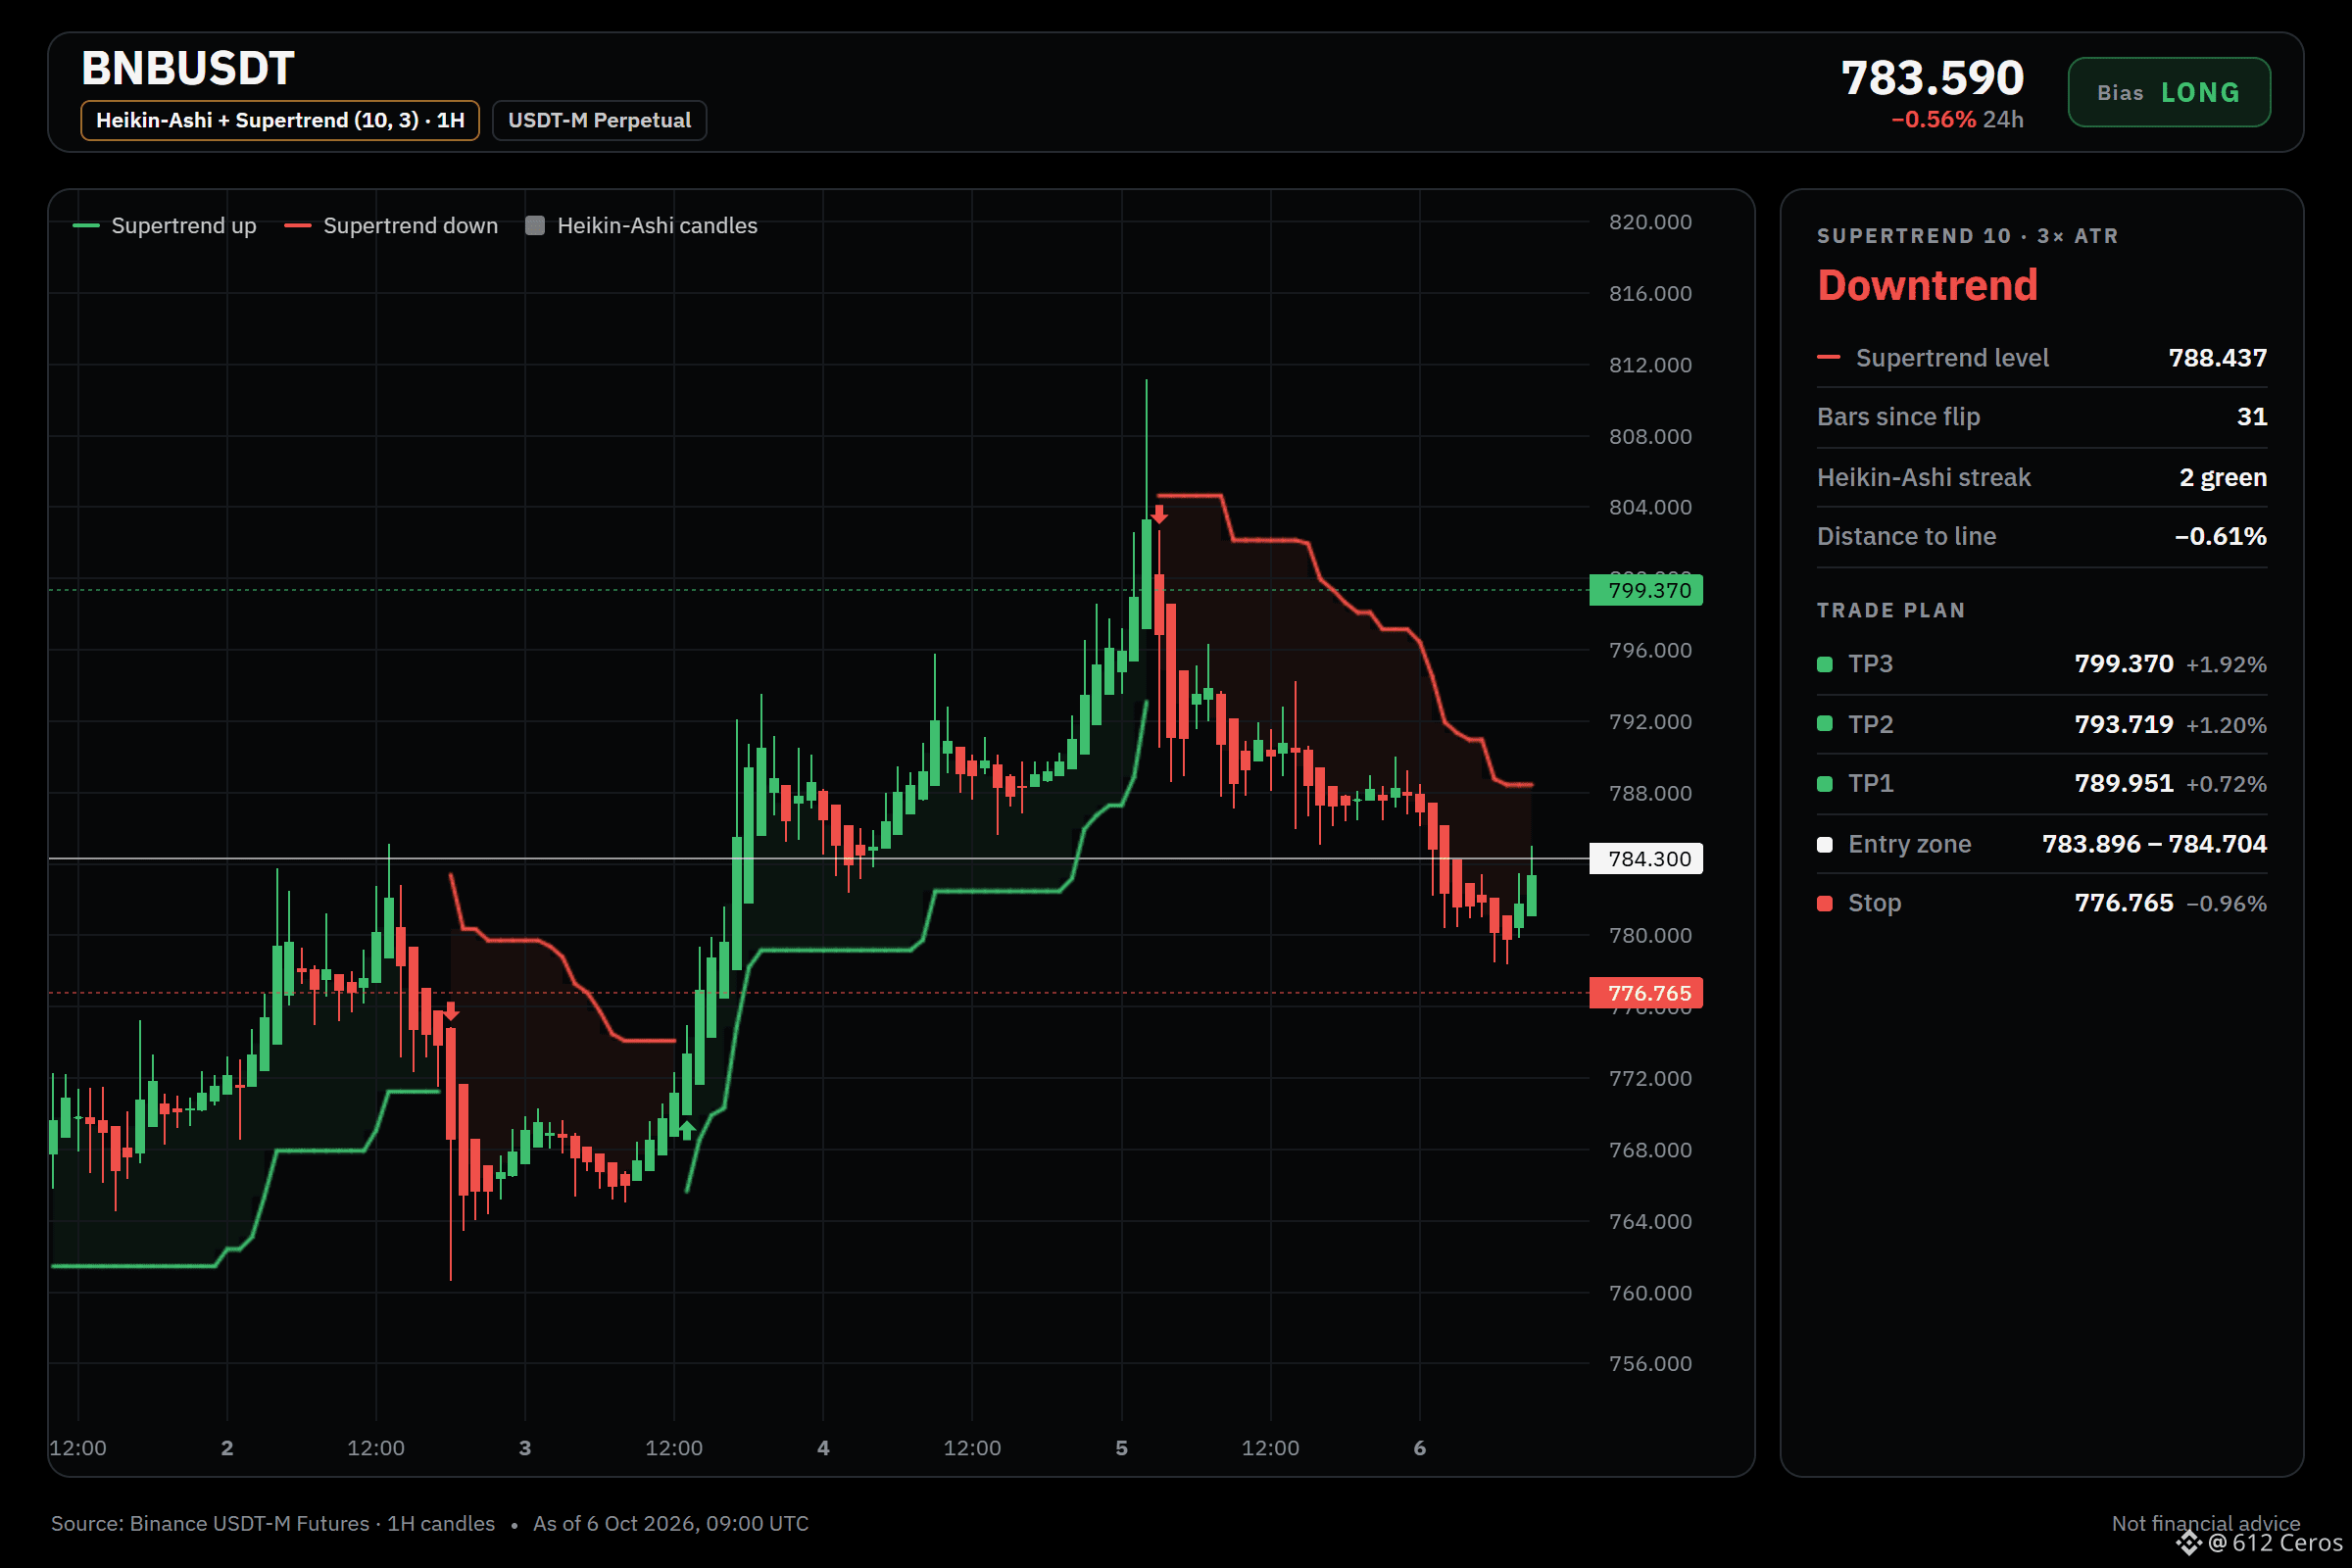
1
730
·
--
صاعد
السعر أعلى من جميع المتوسطات المتحركة الأسية (EMA)، بينما يميل مؤشر RSI إلى التحرك عرضيًا.
🟢 شراء طويل $BTC /USDT: من المتوقع أن يرتفع السعر
الاتجاه: شراء طويل · قوي
الدخول: 86009.46 – 86110.74
الهدف 1: 86743.83 (+0.8%)
الهدف 2: 87199.66 (+1.3%)
الهدف 3: 87883.39 (+2.1%)
وقف الخسارة: 85148.45 (-1.1%)
الخطة: ادخل ضمن النطاق فقط، وجنِ نصف الأرباح عند الهدف 1، ثم انقل وقف الخسارة إلى سعر الدخول.
لماذا الشراء؟ ما الذي تحققت منه: 6/12 من الإشارات متوافقة، و0 معاكسة، و6 غير محسومة
• الاتجاه اليومي: السعر > EMA50 > EMA200، ترتيب صعودي ← الاتجاه العام صاعد
• اتجاه 4 ساعات: السعر > EMA50 > EMA200، ترتيب صعودي ← اتجاه التأرجح صاعد
• اتجاه ساعة واحدة: السعر > EMA50 > EMA200، ترتيب صعودي ← الاتجاه قصير الأجل صاعد
انتبه: تصبح الفكرة غير صالحة إذا وصل السعر إلى وقف الخسارة عند 85148.45
الخلاصة: الاتجاه اليومي صعودي، وهو أقوى إشارة، لكن مؤشر RSI على إطار 4 ساعات محايد، لذا قد يفقد الزخم قوته.
ما هدفك وفق الاتجاه اليومي، وهل أنت مستعد للاحتفاظ بالصفقة حتى اكتمال حركة التأرجح؟
إعداد الصفقة كاملًا في الرسم البياني أدناه.
{future}(BTCUSDT)
📲 هل تريد المزيد من أحدث إشاراتي؟ انضم إليّ هنا:
[https://app.binance.com/uni-qr/D26WbL9t](https://app.binance.com/uni-qr/D26WbL9t)
⚠️ هذا تحليل شخصي للسوق فقط. ليس نصيحة مالية — أدر المخاطر بنفسك وأجرِ بحثك الخاص.
محتوى تعليمي وليس نصيحة استثمارية أو توصية بشراء أي أصل أو بيعه أو إيداعه أو سحبه. لا توجد ترويجات مدفوعة أو روابط إحالة/تسويق بالعمولة.
السعر أعلى من جميع المتوسطات المتحركة الأسية (EMA)، بينما يميل مؤشر RSI إلى التحرك عرضيًا.
🟢 شراء طويل $BTC /USDT: من المتوقع أن يرتفع السعر
الاتجاه: شراء طويل · قوي
الدخول: 86009.46 – 86110.74
الهدف 1: 86743.83 (+0.8%)
الهدف 2: 87199.66 (+1.3%)
الهدف 3: 87883.39 (+2.1%)
وقف الخسارة: 85148.45 (-1.1%)
الخطة: ادخل ضمن النطاق فقط، وجنِ نصف الأرباح عند الهدف 1، ثم انقل وقف الخسارة إلى سعر الدخول.
لماذا الشراء؟ ما الذي تحققت منه: 6/12 من الإشارات متوافقة، و0 معاكسة، و6 غير محسومة
• الاتجاه اليومي: السعر > EMA50 > EMA200، ترتيب صعودي ← الاتجاه العام صاعد
• اتجاه 4 ساعات: السعر > EMA50 > EMA200، ترتيب صعودي ← اتجاه التأرجح صاعد
• اتجاه ساعة واحدة: السعر > EMA50 > EMA200، ترتيب صعودي ← الاتجاه قصير الأجل صاعد
انتبه: تصبح الفكرة غير صالحة إذا وصل السعر إلى وقف الخسارة عند 85148.45
الخلاصة: الاتجاه اليومي صعودي، وهو أقوى إشارة، لكن مؤشر RSI على إطار 4 ساعات محايد، لذا قد يفقد الزخم قوته.
ما هدفك وفق الاتجاه اليومي، وهل أنت مستعد للاحتفاظ بالصفقة حتى اكتمال حركة التأرجح؟
إعداد الصفقة كاملًا في الرسم البياني أدناه.
📲 هل تريد المزيد من أحدث إشاراتي؟ انضم إليّ هنا:
https://app.binance.com/uni-qr/D26WbL9t
⚠️ هذا تحليل شخصي للسوق فقط. ليس نصيحة مالية — أدر المخاطر بنفسك وأجرِ بحثك الخاص.
محتوى تعليمي وليس نصيحة استثمارية أو توصية بشراء أي أصل أو بيعه أو إيداعه أو سحبه. لا توجد ترويجات مدفوعة أو روابط إحالة/تسويق بالعمولة.
🟢 شراء طويل $BTC /USDT: من المتوقع أن يرتفع السعر
الاتجاه: شراء طويل · قوي
الدخول: 86009.46 – 86110.74
الهدف 1: 86743.83 (+0.8%)
الهدف 2: 87199.66 (+1.3%)
الهدف 3: 87883.39 (+2.1%)
وقف الخسارة: 85148.45 (-1.1%)
الخطة: ادخل ضمن النطاق فقط، وجنِ نصف الأرباح عند الهدف 1، ثم انقل وقف الخسارة إلى سعر الدخول.
لماذا الشراء؟ ما الذي تحققت منه: 6/12 من الإشارات متوافقة، و0 معاكسة، و6 غير محسومة
• الاتجاه اليومي: السعر > EMA50 > EMA200، ترتيب صعودي ← الاتجاه العام صاعد
• اتجاه 4 ساعات: السعر > EMA50 > EMA200، ترتيب صعودي ← اتجاه التأرجح صاعد
• اتجاه ساعة واحدة: السعر > EMA50 > EMA200، ترتيب صعودي ← الاتجاه قصير الأجل صاعد
انتبه: تصبح الفكرة غير صالحة إذا وصل السعر إلى وقف الخسارة عند 85148.45
الخلاصة: الاتجاه اليومي صعودي، وهو أقوى إشارة، لكن مؤشر RSI على إطار 4 ساعات محايد، لذا قد يفقد الزخم قوته.
ما هدفك وفق الاتجاه اليومي، وهل أنت مستعد للاحتفاظ بالصفقة حتى اكتمال حركة التأرجح؟
إعداد الصفقة كاملًا في الرسم البياني أدناه.
📲 هل تريد المزيد من أحدث إشاراتي؟ انضم إليّ هنا:
https://app.binance.com/uni-qr/D26WbL9t
⚠️ هذا تحليل شخصي للسوق فقط. ليس نصيحة مالية — أدر المخاطر بنفسك وأجرِ بحثك الخاص.
محتوى تعليمي وليس نصيحة استثمارية أو توصية بشراء أي أصل أو بيعه أو إيداعه أو سحبه. لا توجد ترويجات مدفوعة أو روابط إحالة/تسويق بالعمولة.
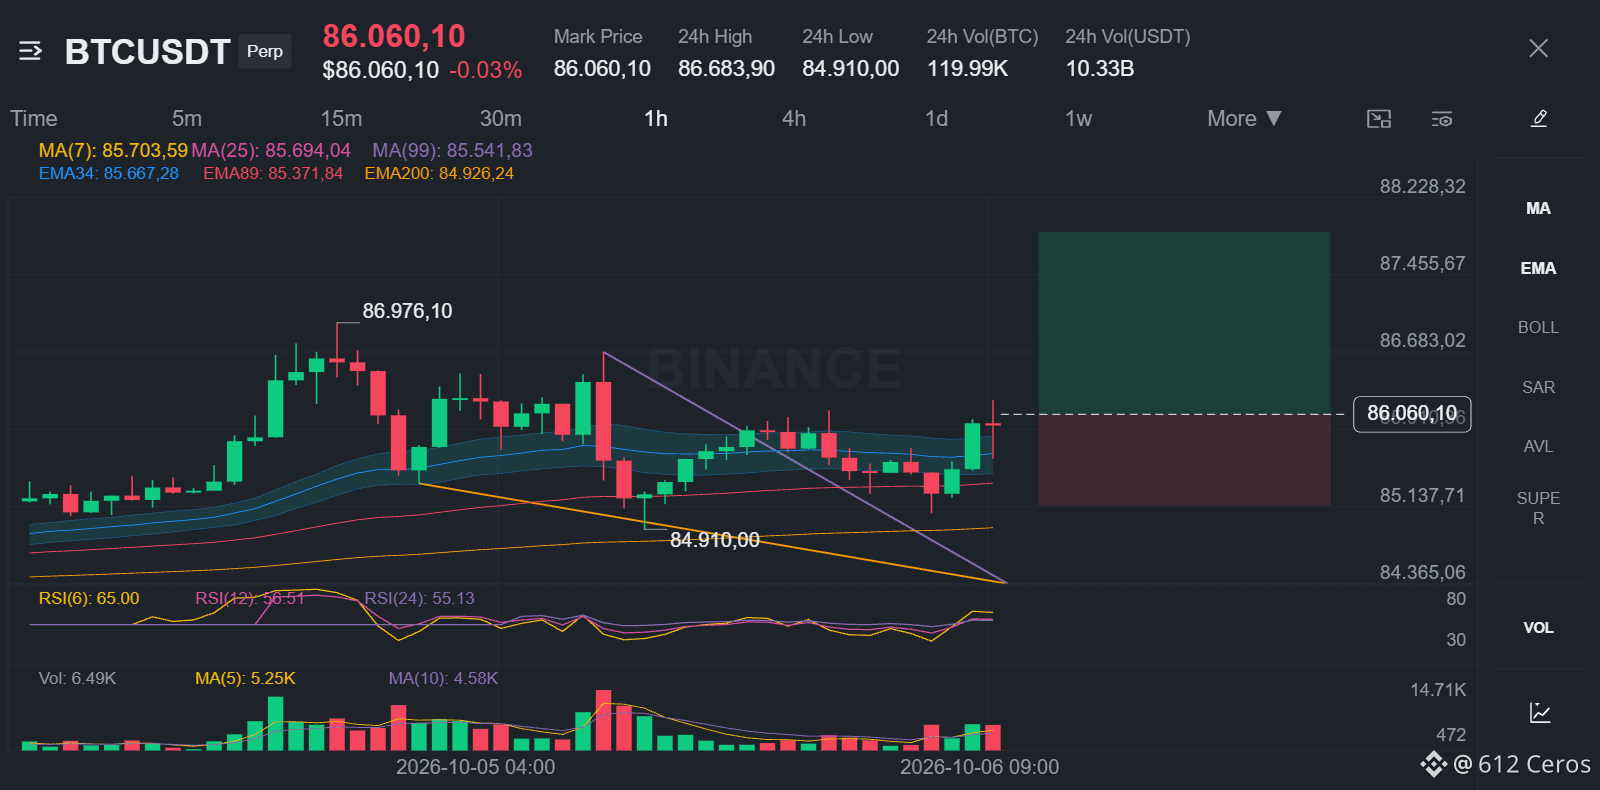
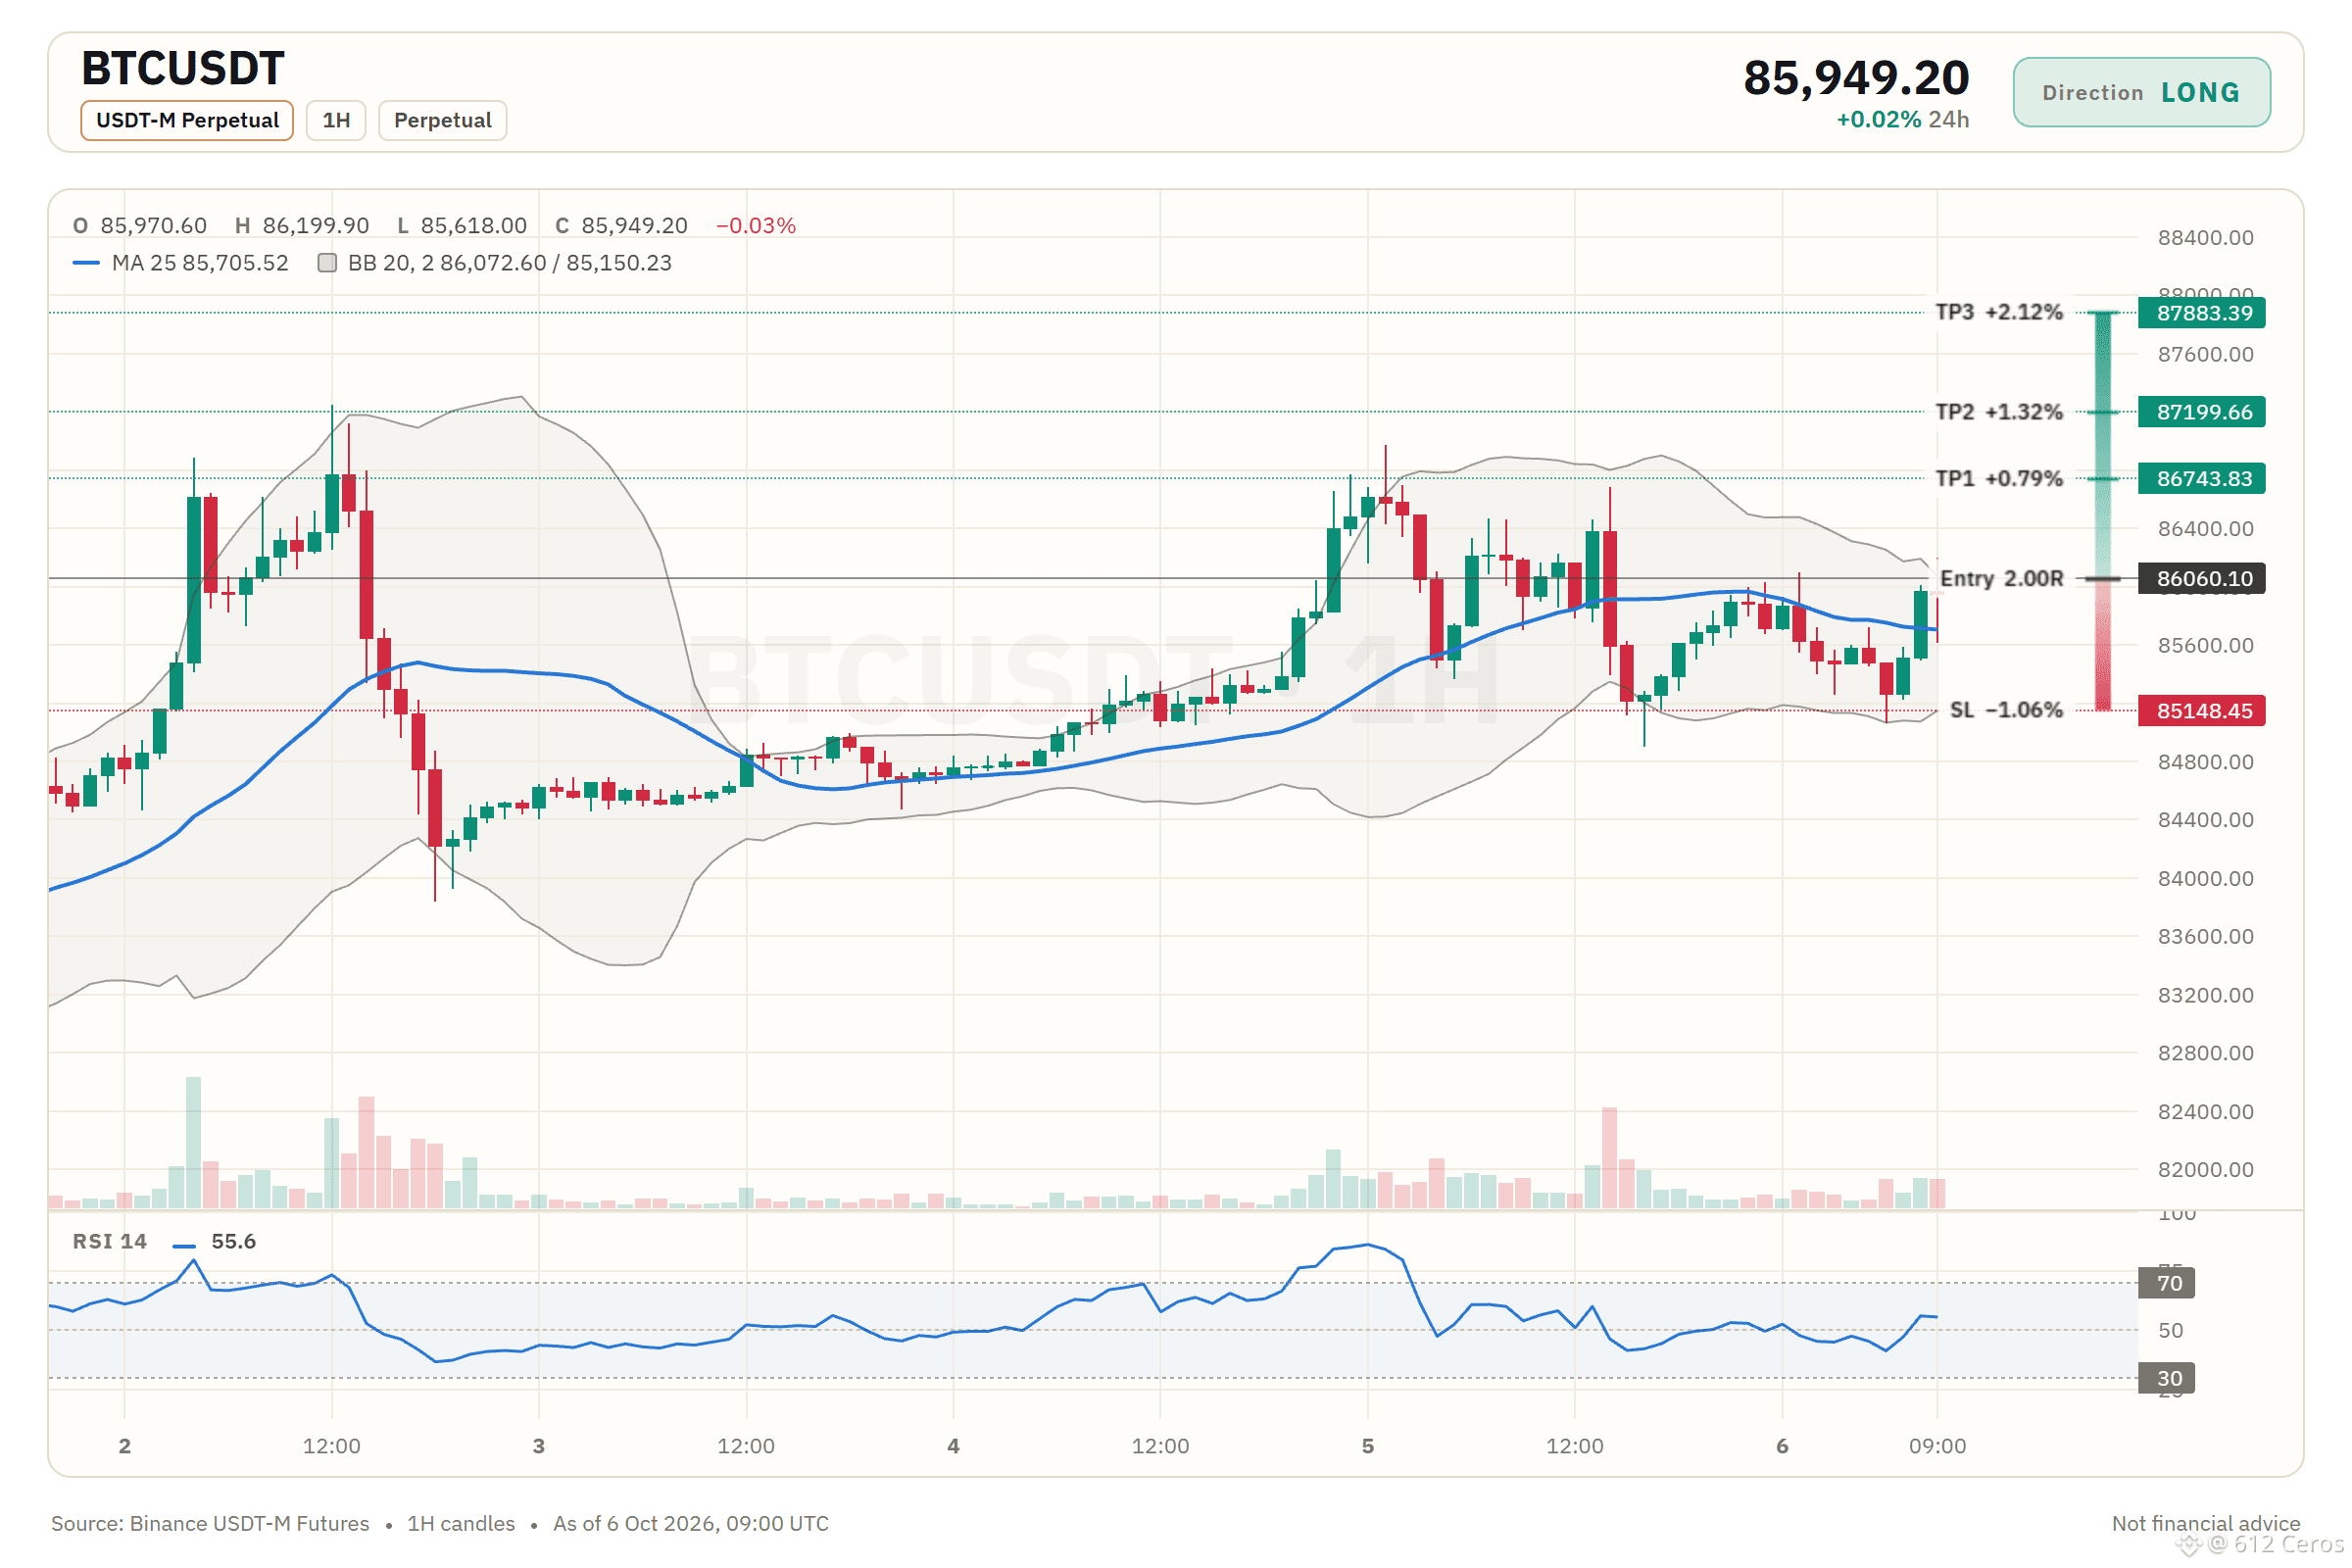
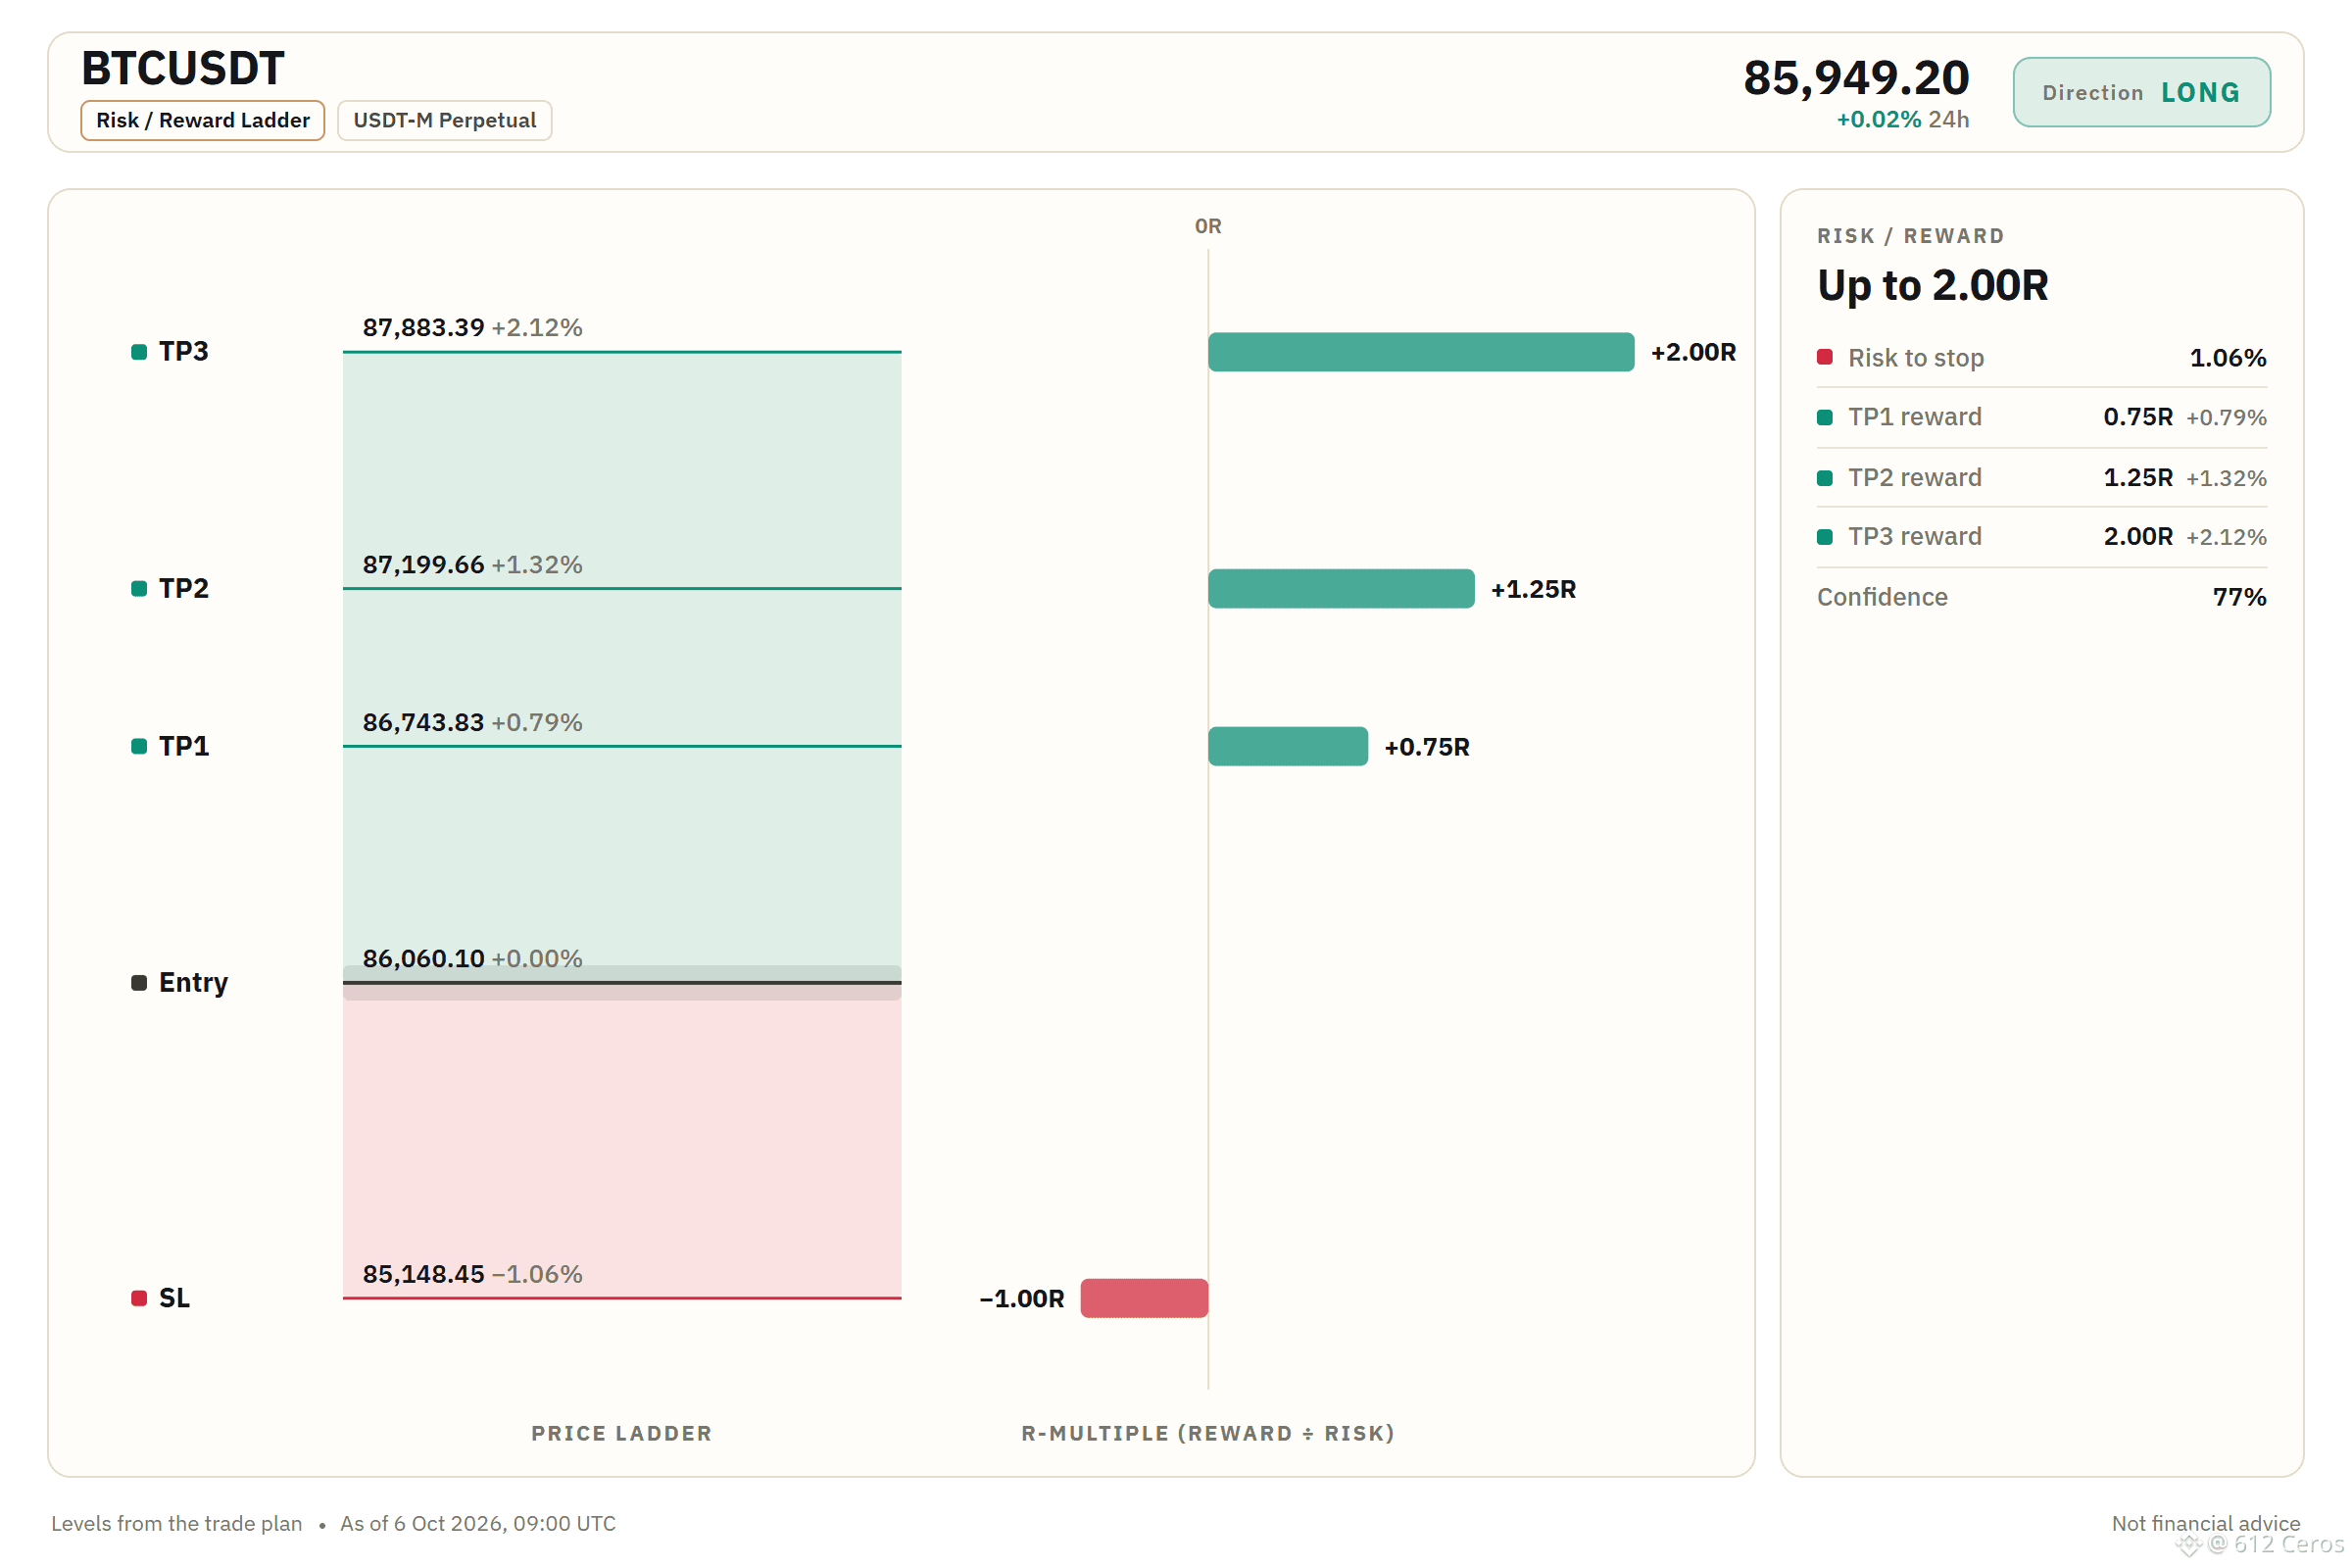
1
718
·
--
صاعد
تتراكم مؤشرات الاتجاه الصاعد اليومي لـ ZEC
🟢 شراء $ZEC /USDT: من المتوقع أن يرتفع السعر
الانحياز: شراء · قوي
الدخول: 1369.64 – 1375.40
جني الأرباح 1: 1406.96 (+2.5%)
جني الأرباح 2: 1429.93 (+4.2%)
جني الأرباح 3: 1464.37 (+6.7%)
وقف الخسارة: 1326.59 (-3.3%)
الخطة: ادخل فقط ضمن النطاق، وخذ نصف الكمية عند جني الأرباح 1، ثم انقل وقف الخسارة إلى سعر الدخول.
لماذا الشراء؟ إشارة قوية، 7/12 من المؤشرات تؤيدها، و0 يعارضها، و5 لم تحسم أمرها.
• الاتجاه اليومي: السعر > EMA50 > EMA200، ترتيب صاعد → الاتجاه العام صاعد
• قوة الاتجاه (ADX/DI، 15 دقيقة): ADX عند 30.0 والمشترون يسيطرون (DI+ عند 37.6 مقابل DI− عند 7.3) → المشترون يقودون الحركة
• وضع BTC: اتجاه BTC صاعد والارتباط 0.63 → BTC يرتفع وهذه العملة تميل إلى اتباعه
ملاحظة في سجل التداول: ZEC
أراقب ZEC بحثًا عن نقطة دخول شراء قرب 1369.64. الاتجاه اليومي صاعد، والسعر على إطار الساعة عند 1372.52، بينما يبلغ RSI على إطار الساعة 68.66، ما يدل على أن الزخم لا يزال بيد المشترين. أريد أن أرى السعر يتجاوز 1375.40 مع استمرار سيطرة المشترين قبل أن أدخل.
أين ستضع مستوى الشراء الخاص بك إذا كنت تنتظر تأكيد الاتجاه اليومي؟
الرسم البياني موضحًا جميع المستويات أدناه.
{future}(ZECUSDT)
📲 هل تريد المزيد من أحدث إشاراتي؟ انضم إليّ هنا:
[https://app.binance.com/uni-qr/D26WbL9t](https://app.binance.com/uni-qr/D26WbL9t)
⚠️ تحليل شخصي للسوق فقط. لا تُعد هذه نصيحة مالية — أدر المخاطر بنفسك وأجرِ بحثك الخاص.
محتوى تعليمي وليس نصيحة استثمارية أو توصية بشراء أي أصل أو بيعه أو إيداعه أو سحبه. لا توجد ترويجات مدفوعة أو روابط إحالة/تسويق بالعمولة.
تتراكم مؤشرات الاتجاه الصاعد اليومي لـ ZEC
🟢 شراء $ZEC /USDT: من المتوقع أن يرتفع السعر
الانحياز: شراء · قوي
الدخول: 1369.64 – 1375.40
جني الأرباح 1: 1406.96 (+2.5%)
جني الأرباح 2: 1429.93 (+4.2%)
جني الأرباح 3: 1464.37 (+6.7%)
وقف الخسارة: 1326.59 (-3.3%)
الخطة: ادخل فقط ضمن النطاق، وخذ نصف الكمية عند جني الأرباح 1، ثم انقل وقف الخسارة إلى سعر الدخول.
لماذا الشراء؟ إشارة قوية، 7/12 من المؤشرات تؤيدها، و0 يعارضها، و5 لم تحسم أمرها.
• الاتجاه اليومي: السعر > EMA50 > EMA200، ترتيب صاعد → الاتجاه العام صاعد
• قوة الاتجاه (ADX/DI، 15 دقيقة): ADX عند 30.0 والمشترون يسيطرون (DI+ عند 37.6 مقابل DI− عند 7.3) → المشترون يقودون الحركة
• وضع BTC: اتجاه BTC صاعد والارتباط 0.63 → BTC يرتفع وهذه العملة تميل إلى اتباعه
ملاحظة في سجل التداول: ZEC
أراقب ZEC بحثًا عن نقطة دخول شراء قرب 1369.64. الاتجاه اليومي صاعد، والسعر على إطار الساعة عند 1372.52، بينما يبلغ RSI على إطار الساعة 68.66، ما يدل على أن الزخم لا يزال بيد المشترين. أريد أن أرى السعر يتجاوز 1375.40 مع استمرار سيطرة المشترين قبل أن أدخل.
أين ستضع مستوى الشراء الخاص بك إذا كنت تنتظر تأكيد الاتجاه اليومي؟
الرسم البياني موضحًا جميع المستويات أدناه.
📲 هل تريد المزيد من أحدث إشاراتي؟ انضم إليّ هنا:
https://app.binance.com/uni-qr/D26WbL9t
⚠️ تحليل شخصي للسوق فقط. لا تُعد هذه نصيحة مالية — أدر المخاطر بنفسك وأجرِ بحثك الخاص.
محتوى تعليمي وليس نصيحة استثمارية أو توصية بشراء أي أصل أو بيعه أو إيداعه أو سحبه. لا توجد ترويجات مدفوعة أو روابط إحالة/تسويق بالعمولة.
🟢 شراء $ZEC /USDT: من المتوقع أن يرتفع السعر
الانحياز: شراء · قوي
الدخول: 1369.64 – 1375.40
جني الأرباح 1: 1406.96 (+2.5%)
جني الأرباح 2: 1429.93 (+4.2%)
جني الأرباح 3: 1464.37 (+6.7%)
وقف الخسارة: 1326.59 (-3.3%)
الخطة: ادخل فقط ضمن النطاق، وخذ نصف الكمية عند جني الأرباح 1، ثم انقل وقف الخسارة إلى سعر الدخول.
لماذا الشراء؟ إشارة قوية، 7/12 من المؤشرات تؤيدها، و0 يعارضها، و5 لم تحسم أمرها.
• الاتجاه اليومي: السعر > EMA50 > EMA200، ترتيب صاعد → الاتجاه العام صاعد
• قوة الاتجاه (ADX/DI، 15 دقيقة): ADX عند 30.0 والمشترون يسيطرون (DI+ عند 37.6 مقابل DI− عند 7.3) → المشترون يقودون الحركة
• وضع BTC: اتجاه BTC صاعد والارتباط 0.63 → BTC يرتفع وهذه العملة تميل إلى اتباعه
ملاحظة في سجل التداول: ZEC
أراقب ZEC بحثًا عن نقطة دخول شراء قرب 1369.64. الاتجاه اليومي صاعد، والسعر على إطار الساعة عند 1372.52، بينما يبلغ RSI على إطار الساعة 68.66، ما يدل على أن الزخم لا يزال بيد المشترين. أريد أن أرى السعر يتجاوز 1375.40 مع استمرار سيطرة المشترين قبل أن أدخل.
أين ستضع مستوى الشراء الخاص بك إذا كنت تنتظر تأكيد الاتجاه اليومي؟
الرسم البياني موضحًا جميع المستويات أدناه.
📲 هل تريد المزيد من أحدث إشاراتي؟ انضم إليّ هنا:
https://app.binance.com/uni-qr/D26WbL9t
⚠️ تحليل شخصي للسوق فقط. لا تُعد هذه نصيحة مالية — أدر المخاطر بنفسك وأجرِ بحثك الخاص.
محتوى تعليمي وليس نصيحة استثمارية أو توصية بشراء أي أصل أو بيعه أو إيداعه أو سحبه. لا توجد ترويجات مدفوعة أو روابط إحالة/تسويق بالعمولة.
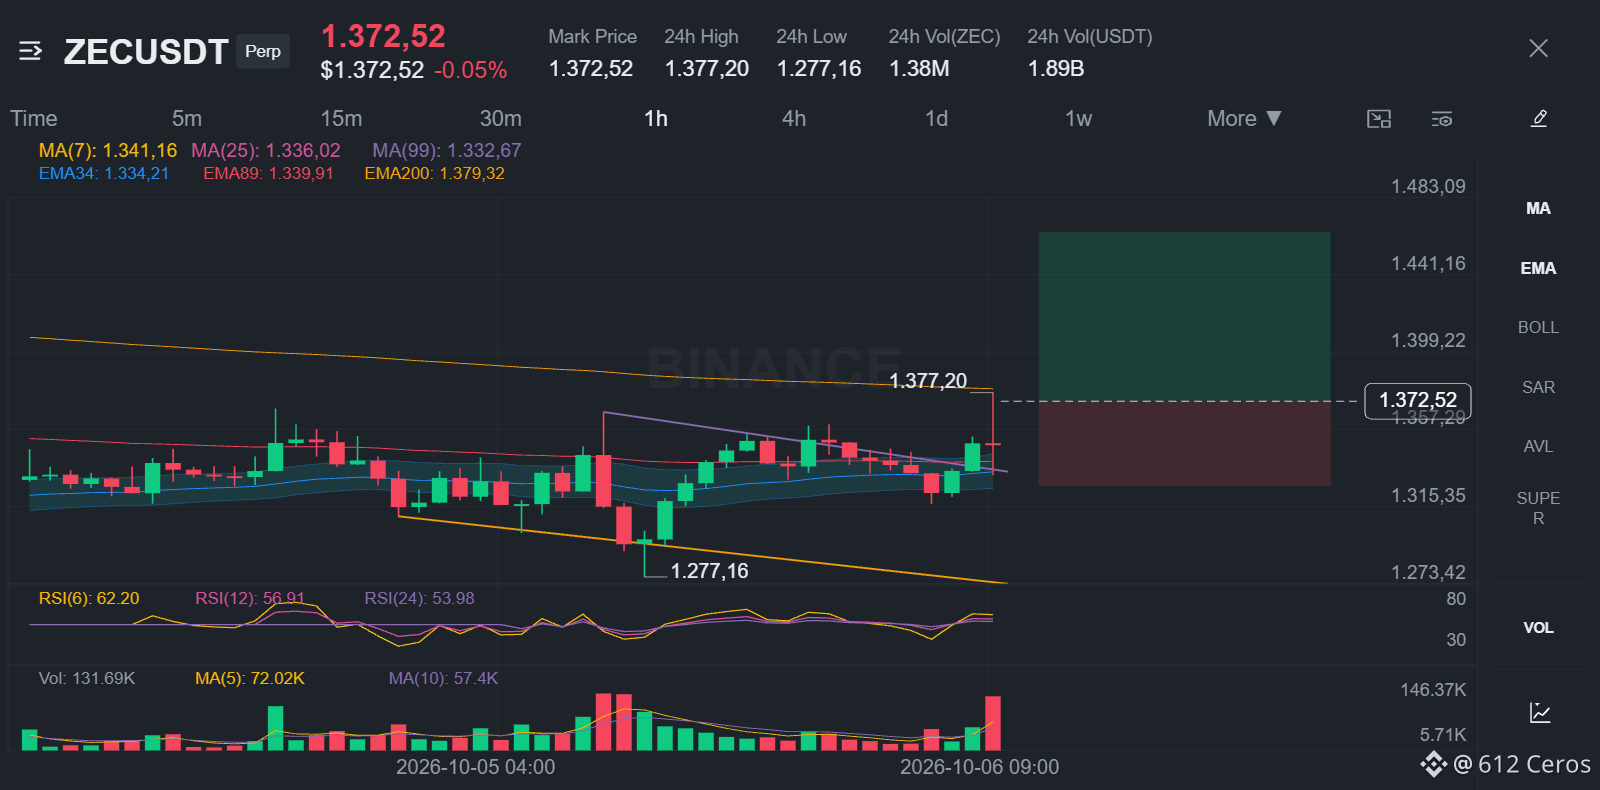
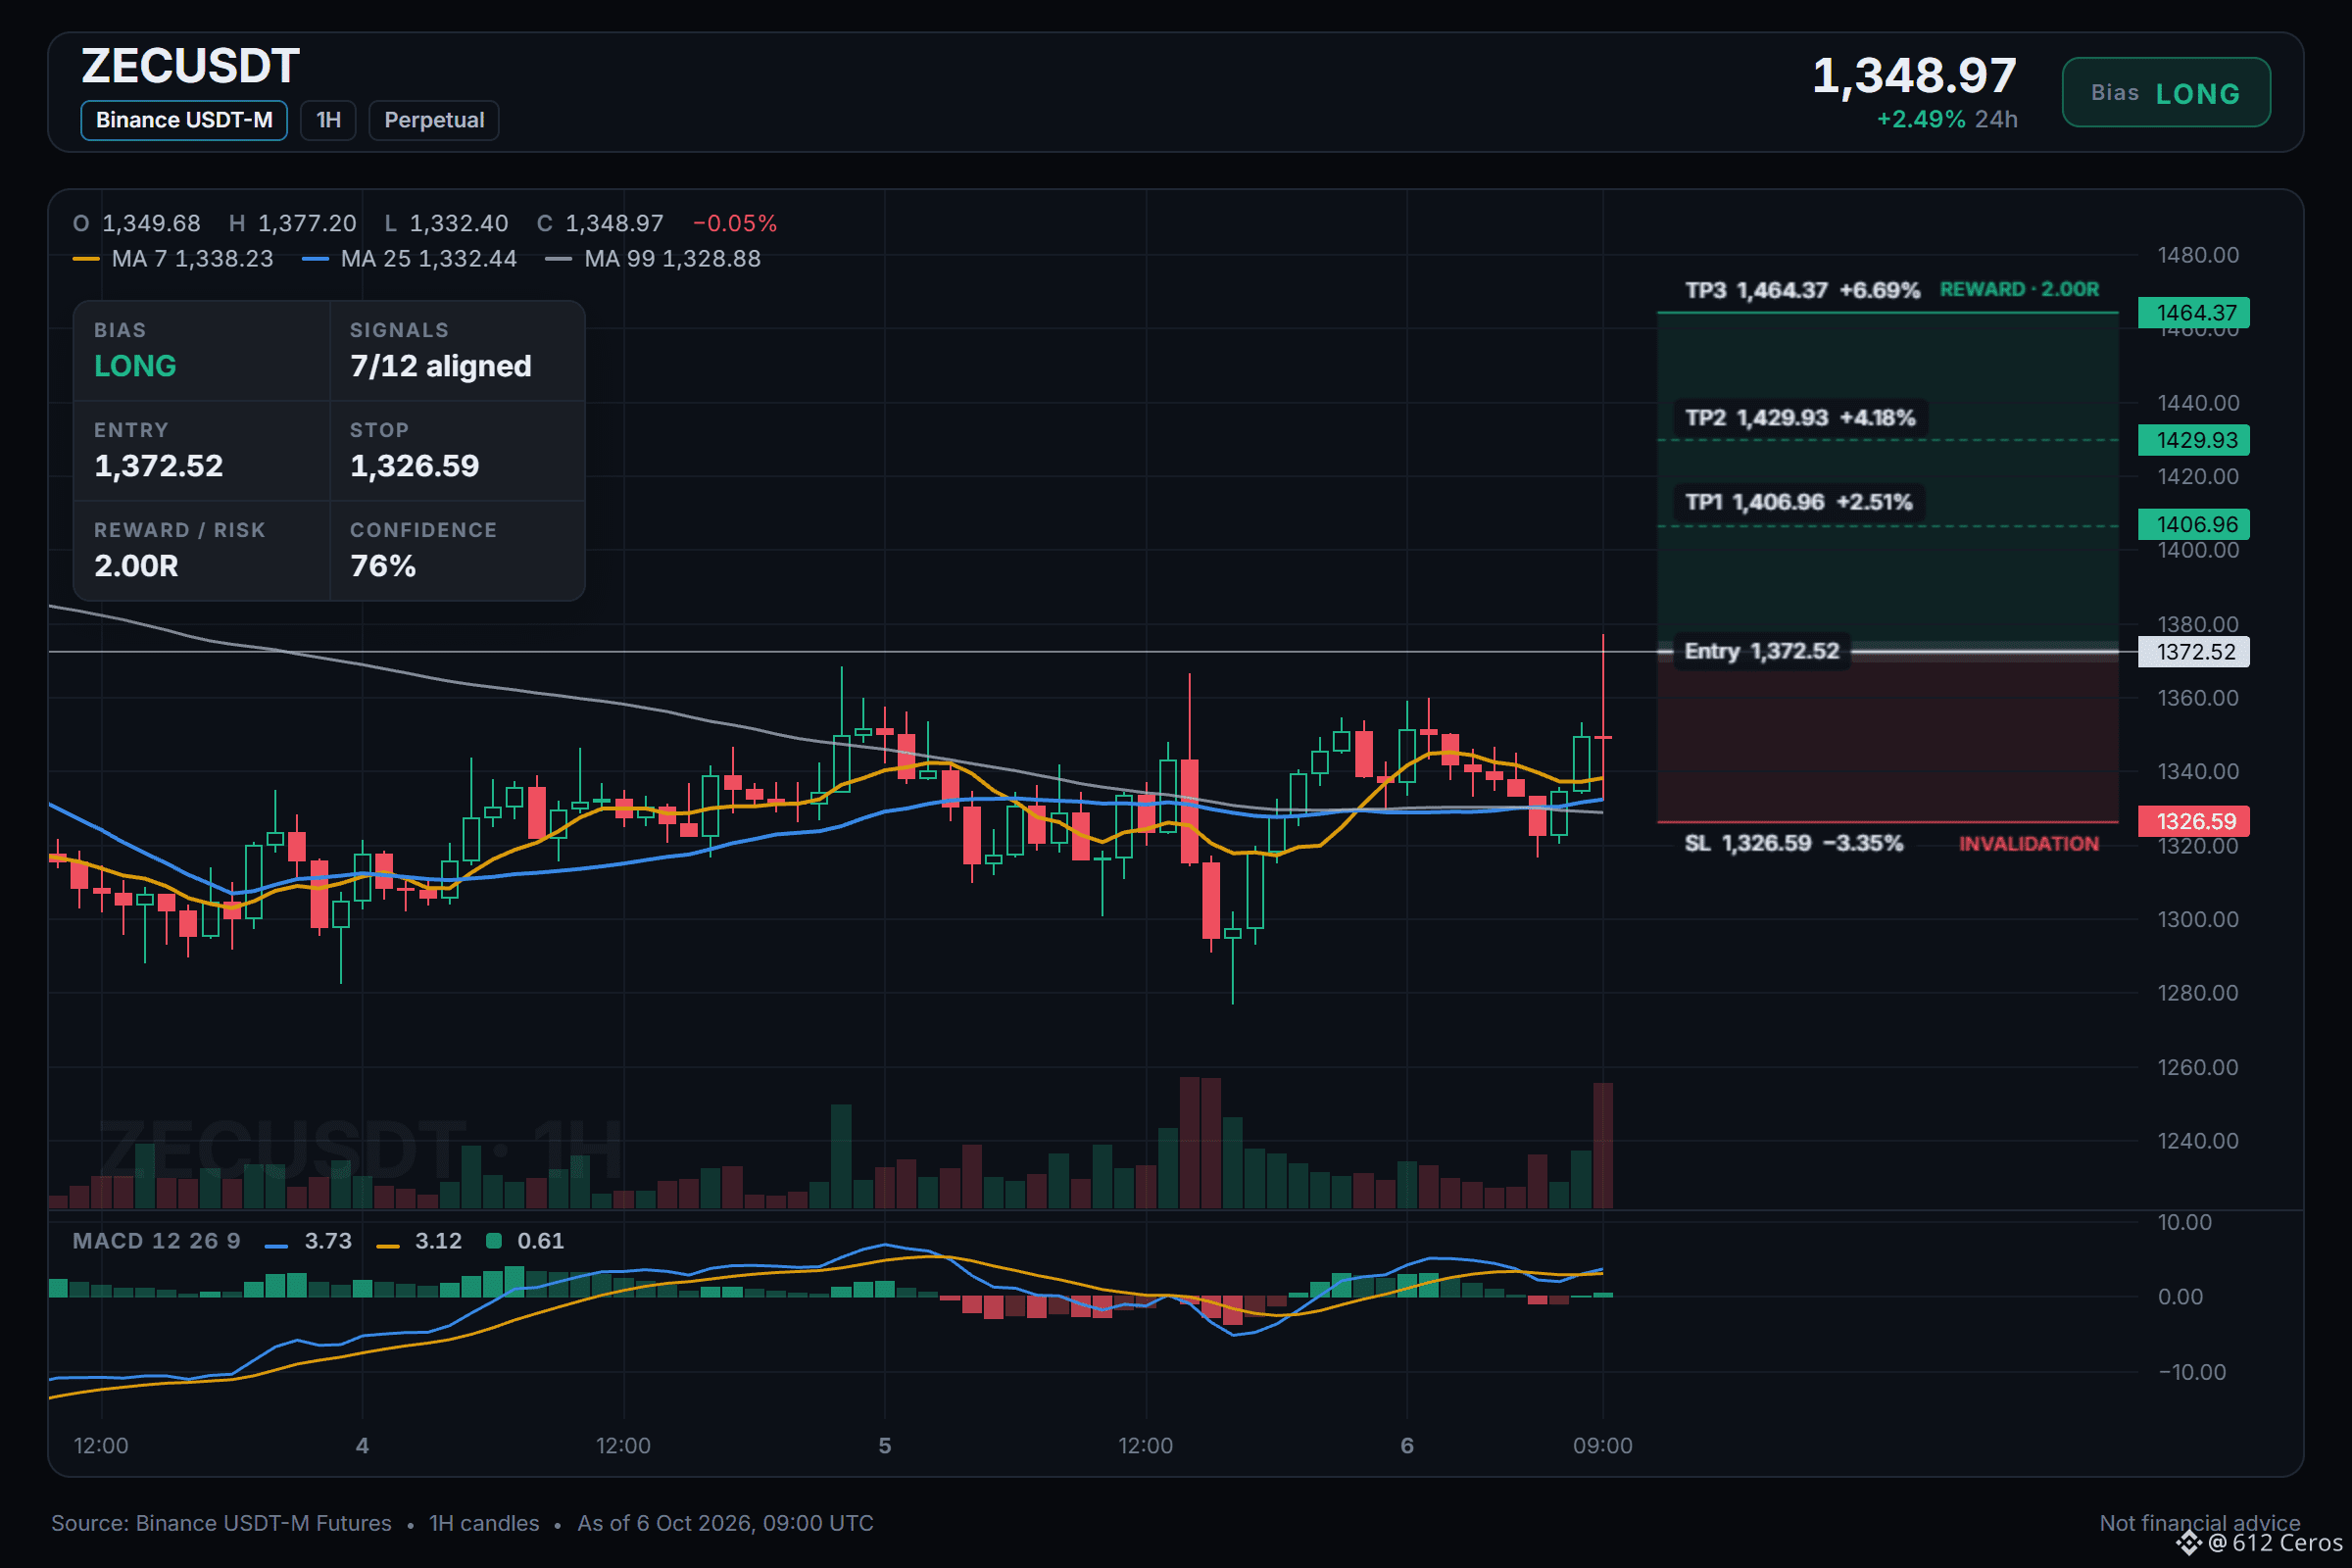
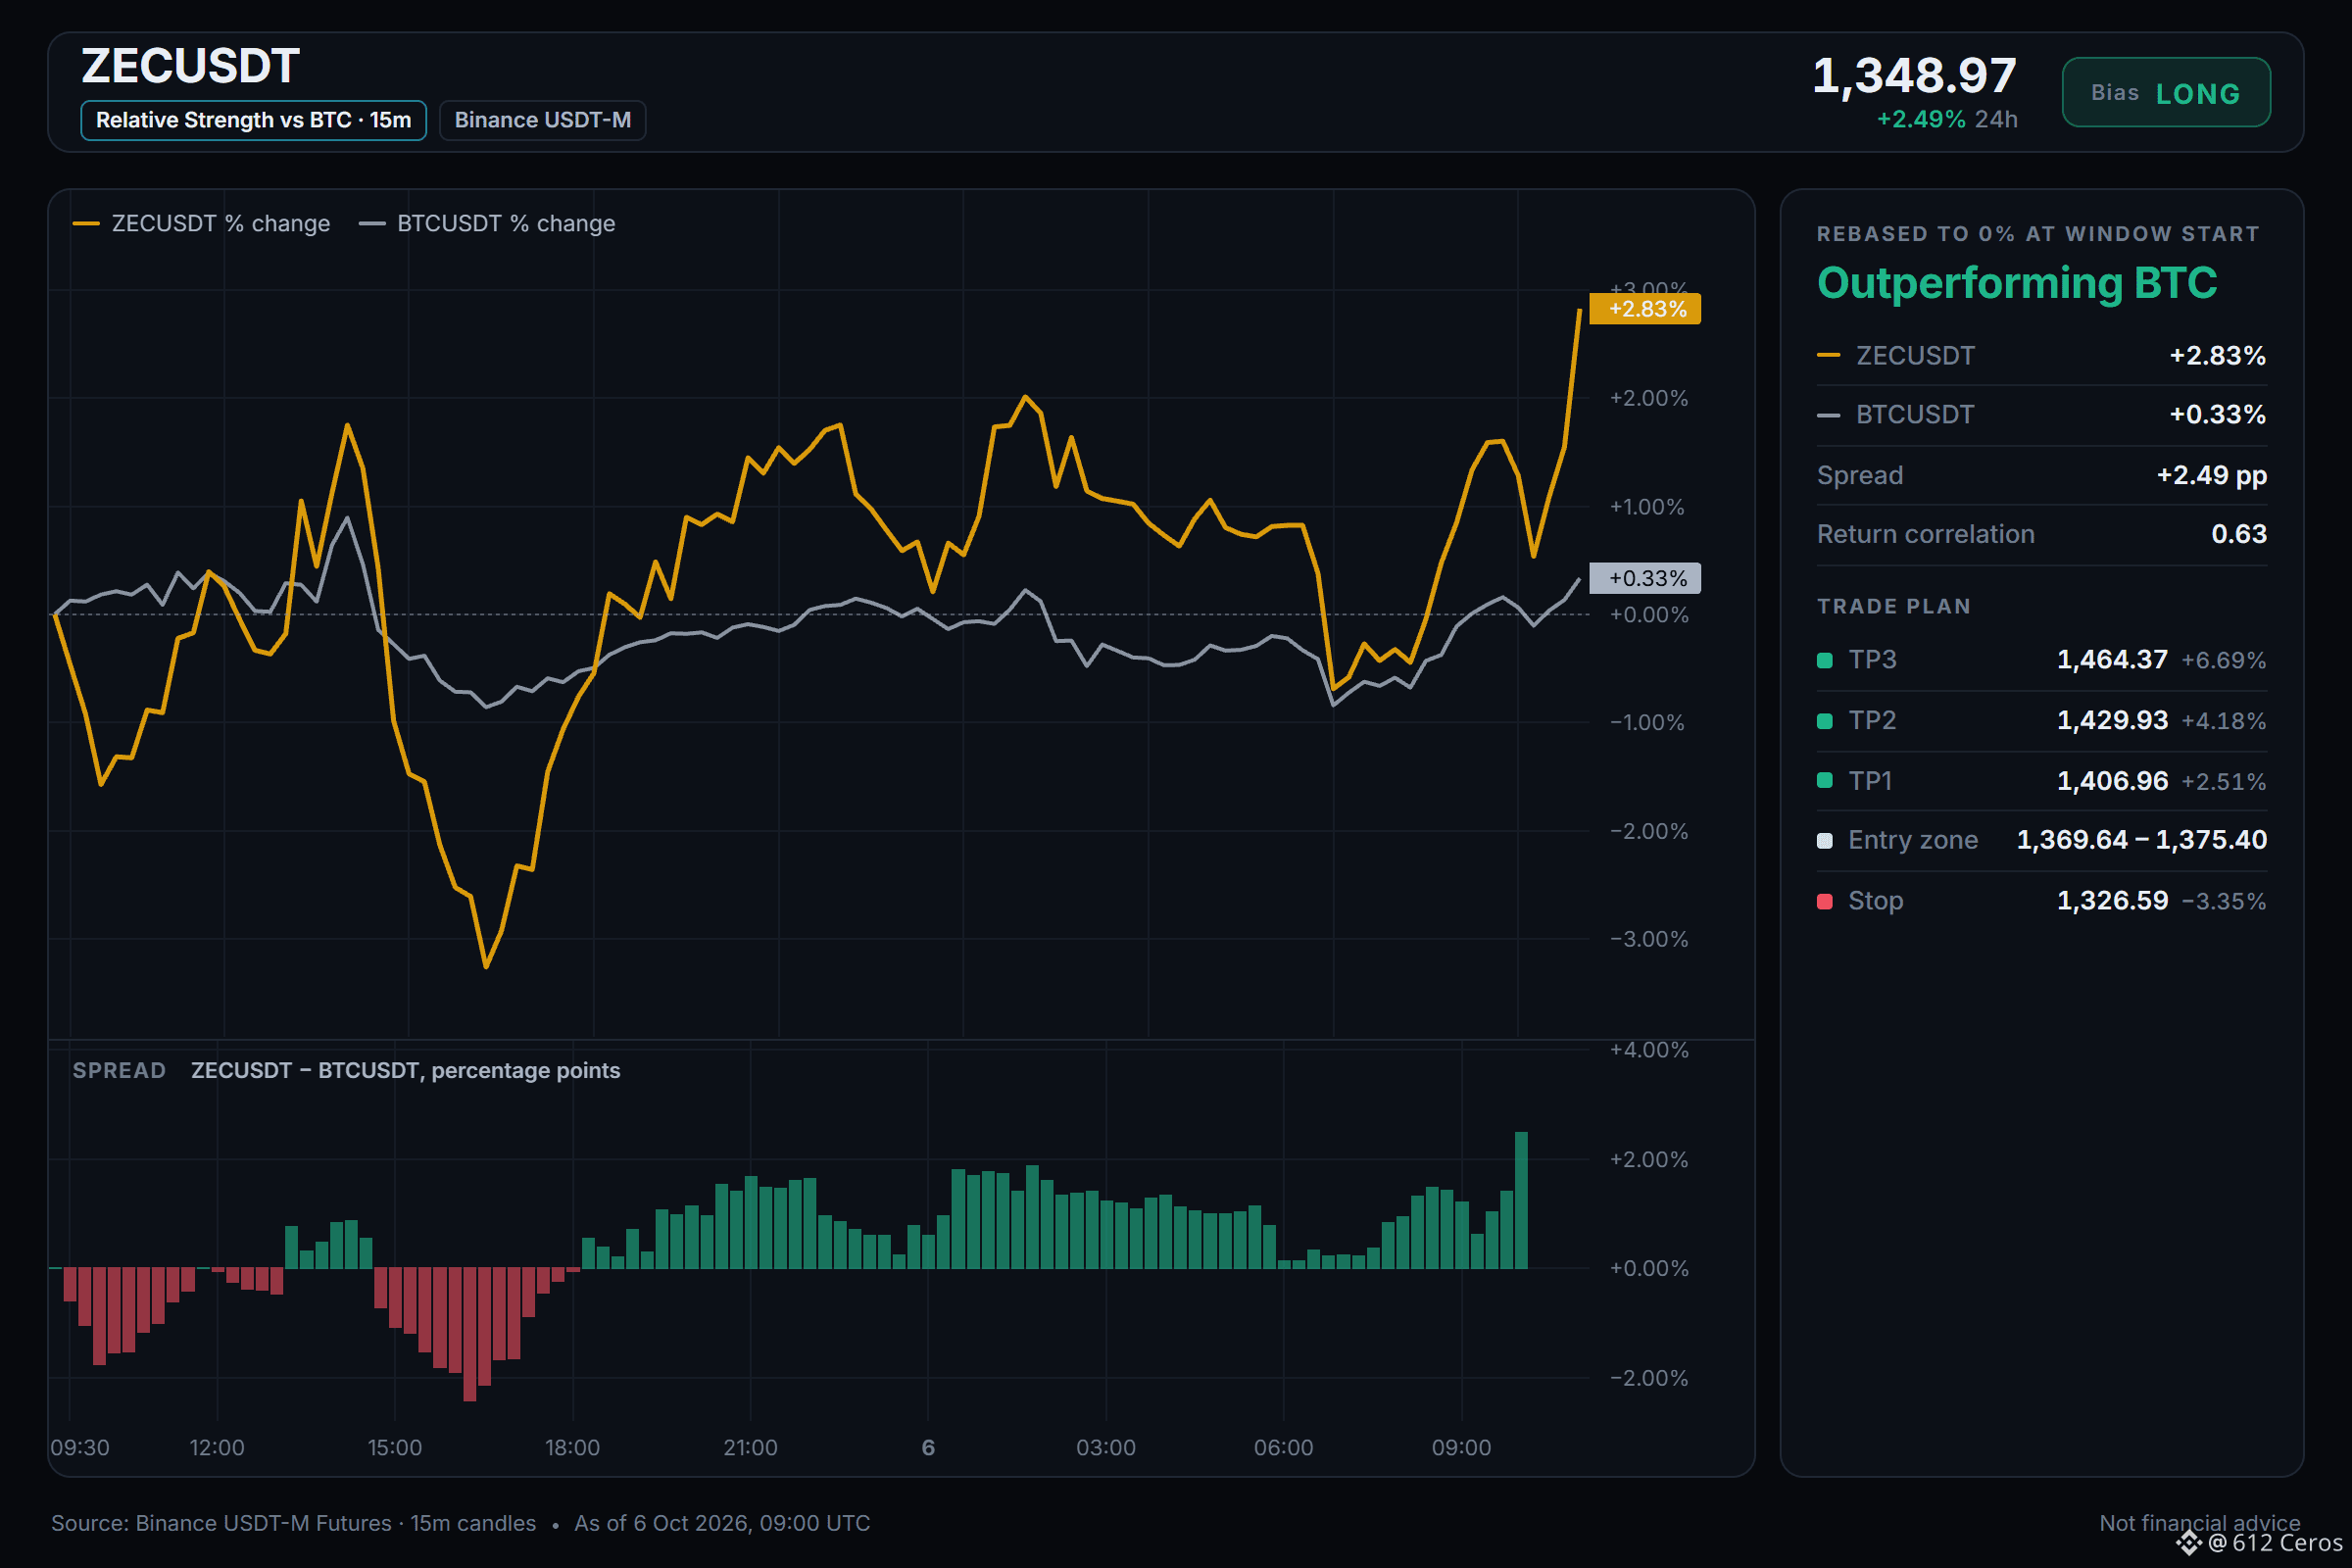
860
سجّل الدخول لاستكشاف المزيد من المُحتوى
انضم إلى مُستخدمي العملات الرقمية حول العالم على Binance Square
⚡️ احصل على أحدث المعلومات المفيدة عن العملات الرقمية.
💬 موثوقة من قبل أكبر منصّة لتداول العملات الرقمية في العالم.
👍 اكتشف الرؤى الحقيقية من صنّاع المُحتوى الموثوقين.
البريد الإلكتروني / رقم الهاتف
المواضيع الرائجة
BinanceLaunchesBinanceIntelligence
287,906 مشاهدات
2,501 يقومون بالنقاش
#BinanceLaunchesBinanceIntelligence
ثورة الذكاء الاصطناعي تصل إلى عالم التداول الرقمي
أعلنت منصة Binance رسمياً عن إطلاق منظومتها الذكية الجديدة Binance Intelligence، في خطوة تمثل نقلة نوعية نحو دمج أدوات الذكاء الاصطناعي الاصطناعي في صلب تجربة التداول اليومية للمستخدمين. تهدف هذه المبادرة إلى سد الفجوة المعرفية في الأسواق المالية وتمكين المتداولين—من المبتدئين إلى المحترفين—من تحليل البيانات وتصميم استراتيجيات التداول بلغة طبيعية ودون الحاجة إلى خبرة برمجية.
الركائز الثلاث لمنظومة Binance Intelligence
تتكون المنظومة الجديدة من ثلاثة منتجات رئيسية صُممت لتغطي كافة احتياجات المستخدمين والمطورين:
Binance AI (مجاني للجميع):
يجمع إشارات السوق المشتتة (الرسوم البيانية، الأخبار، بيانات الأونشين On-Chain، والمؤشرات الاقتصادية) في واجهة واحدة موحدة.
يقدم موجزاً آلياً للسوق (Market Brief) يتحدث كل 4 ساعات بالصوت والنص، يغطي العملات الرقمية والأسواق العالمية.
Binance AI Pro (لبناء الاستراتيجيات):
يتيح للمستخدم كتابة فكرة التداول بلغة بسيطة، ليقوم الذكاء الاصطناعي بتحويلها إلى مسار عمل مرئي (Visual Flowchart).
يوفر ميزة التداول الافتراضي (Paper Trading) لاختبار الاستراتيجيات قبل تنفيذها بأموال حقيقية.
#BinanceLaunchesBinanceIntelligence
#BinanceSquareFamily #AI
Redouanecrypto
·7 إعجاب
·5.6k مشاهدات
BitcoinTargets2026OpenAt$87570
589 مشاهدات
36 يقومون بالنقاش
BitcoinRejectedAt$87KThirdTime
752 مشاهدات
41 يقومون بالنقاش