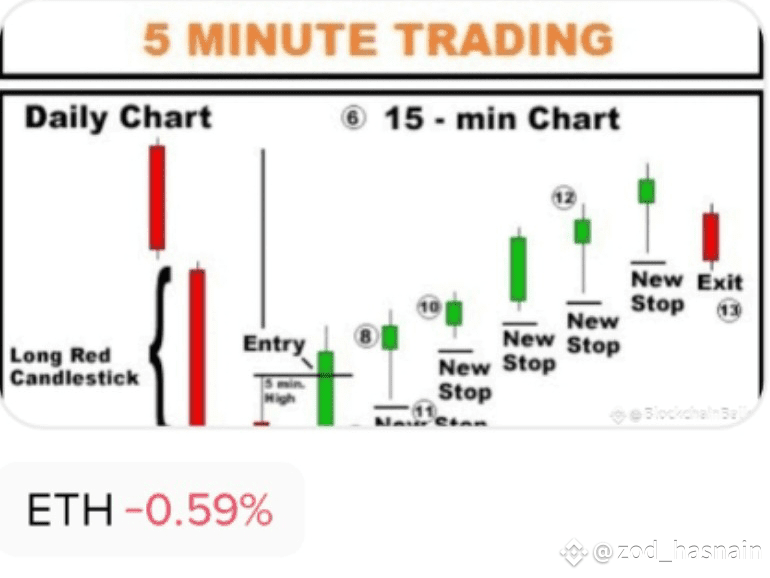
How to Read a Crypto Chart in 5 Minutes
When you first open a crypto chart, all the lines, candles, and indicators might look confusing. But the good news is you don’t need to be a professional trader to understand the basics. With just a few simple steps, you can learn to read a crypto chart in under 5 minutes and start making smarter trading decisions.
Step 1: Understand the Candlesticks
Most crypto charts use candlestick charts instead of plain lines.
Green candle (or white): Price went up during that time frame.
Red candle (or black): Price went down.
Candle body: Shows where the price opened and closed.
Wicks (shadows): Show the highest and lowest price reached in that time frame.
Example: If Bitcoin’s candle opens at $40,000 and closes at $42,000, the candle will be green.
Step 2: Time Frames Matter
Charts can be set to different time frames:
1 Minute / 5 Minute Charts: For day traders looking at quick moves.
1 Hour / 4 Hour Charts: Good for swing trading and short-term analysis.
Daily / Weekly Charts: Best for long-term investors.
Pro tip: The bigger the time frame, the more reliable the trend.
Step 3: Spot the Trend
Ask yourself one question: Is the price moving up, down, or sideways?
Uptrend: Higher highs and higher lows (bullish).
Downtrend: Lower highs and lower lows (bearish).
Sideways (consolidation): Price moves in a range without a clear direction.
Remember: “The trend is your friend.” Don’t fight it.
Step 4: Identify Key Levels (Support & Resistance)
Support: A price level where buyers step in (floor).
Resistance: A price level where sellers take profits (ceiling).
Example: If $ETH keeps bouncing around $2,500, that’s support. If it struggles to break $3,000, that’s resistance.
These levels often decide whether the price bounces back or breaks out.
Step 5: Use Simple Indicators
You don’t need 20 indicators. Start with the basics:
Moving Averages (MA): Shows average price over time (helps spot trends).
Relative Strength Index (RSI): Measures momentum. Above 70 = overbought (price may drop). Below 30 = oversold (price may rise).
When you first open a crypto chart, all the lines, candles, and indicators might look confusing. But the good news is you don’t need to be a professional trader to understand the basics. With just a few simple steps, you can learn to read a crypto chart in under 5 minutes and start making smarter trading decisions.
Step 1: Understand the Candlesticks
Most crypto charts use candlestick charts instead of plain lines.
Green candle (or white): Price went up during that time frame.
Red candle (or black): Price went down.
Candle body: Shows where the price opened and closed.
Wicks (shadows): Show the highest and lowest price reached in that time frame.
Example: If Bitcoin’s candle opens at $40,000 and closes at $42,000, the candle will be green.
Step 2: Time Frames Matter
Charts can be set to different time frames:
1 Minute / 5 Minute Charts: For day traders looking at quick moves.
1 Hour / 4 Hour Charts: Good for swing trading and short-term analysis.
Daily / Weekly Charts: Best for long-term investors.
Pro tip: The bigger the time frame, the more reliable the trend.
Step 3: Spot the Trend
Ask yourself one question: Is the price moving up, down, or sideways?
Uptrend: Higher highs and higher lows (bullish).
Downtrend: Lower highs and lower lows (bearish).
Sideways (consolidation): Price moves in a range without a clear direction.
Remember: “The trend is your friend.” Don’t fight it.
Step 4: Identify Key Levels (Support & Resistance)
Support: A price level where buyers step in (floor).
Resistance: A price level where sellers take profits (ceiling).
Example: If $ETH keeps bouncing around $2,500, that’s support. If it struggles to break $3,000, that’s resistance.
These levels often decide whether the price bounces back or breaks out.
Step 5: Use Simple Indicators
You don’t need 20 indicators. Start with the basics:
Moving Averages (MA): Shows average price over time (helps spot trends).
Relative Strength Index (RSI): Measures momentum. Above 70 = overbought (price may drop). Below 30 = oversold (price may rise).