

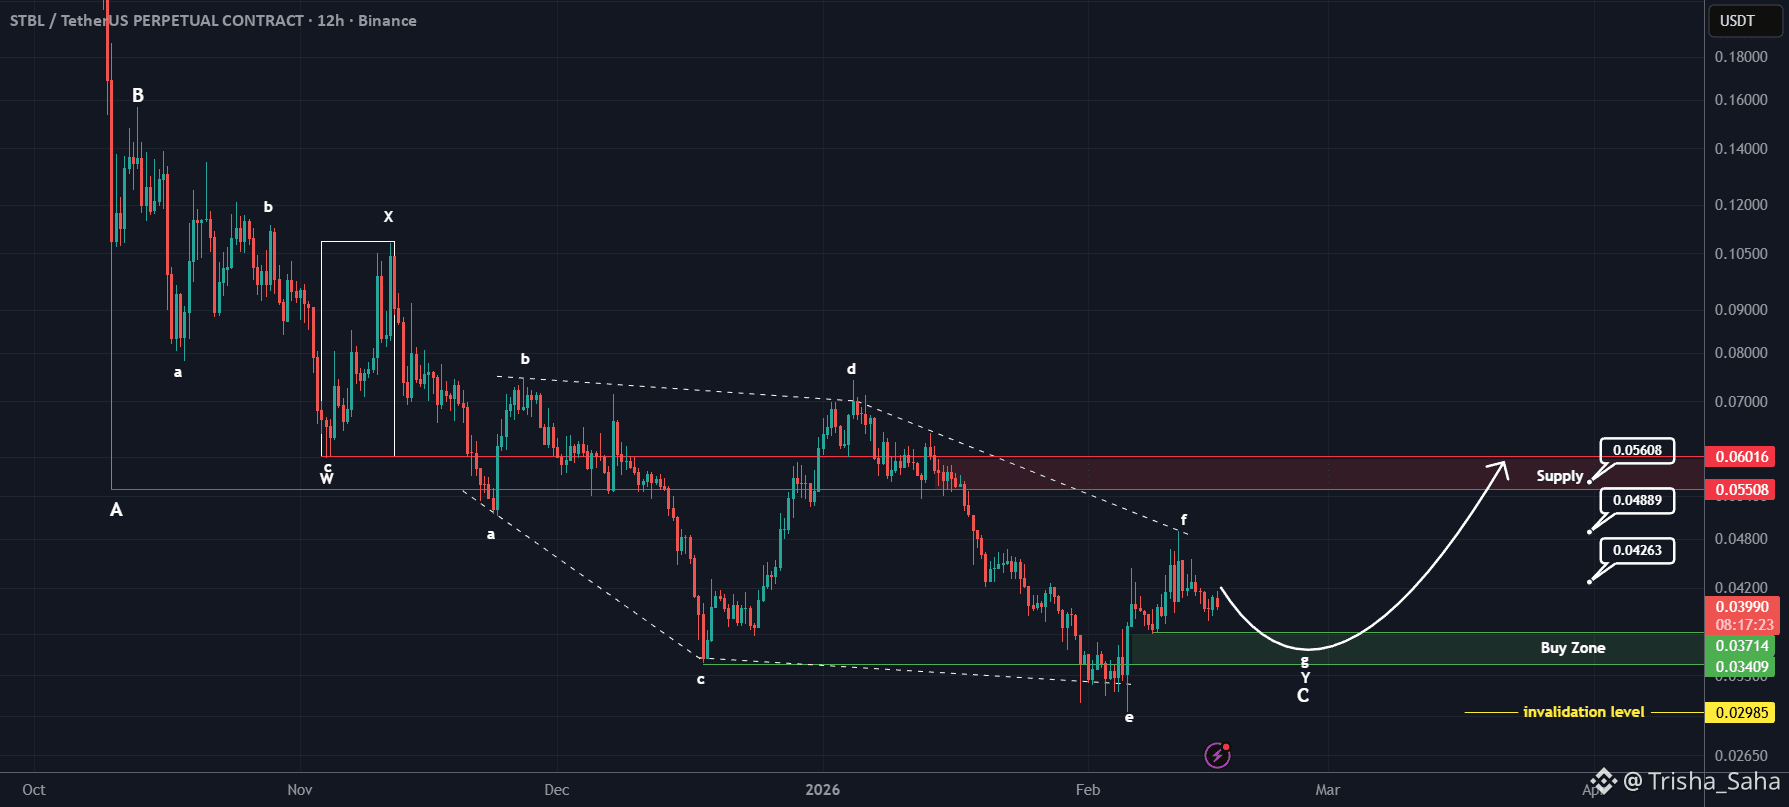
From a structural perspective, it appears that Wave C is approaching completion. This Wave C is not an isolated move, but part of a larger corrective formation within the higher-timeframe structure.
Looking deeper into the internal subdivisions, Wave C seems to be unfolding as a double correction. The second segment of this correction is developing as a diametric pattern, and based on the current wave progression, we are now likely in the final leg of that structure. If this interpretation is correct, the market is nearing the end of its corrective phase and preparing for a potential directional expansion.
The green zone marked on the chart represents our primary area of interest for potential long positions. Rather than entering with full allocation at once, the plan is to build the position gradually using a DCA (Dollar-Cost Averaging) approach. This allows for better risk distribution and flexibility in case of minor deviations or liquidity sweeps within the zone.
The upside targets are clearly defined on the chart and correspond to logical liquidity areas and prior structural resistance levels. These levels will serve as potential reaction points where partial profits can be secured depending on momentum and market conditions.
However, risk management remains essential. A daily candle close below the invalidation level will invalidate this wave count and the bullish scenario entirely. In that case, the structure would require reassessment, as it would suggest that the correction is either extending or that a larger bearish phase is unfolding.
As always, this analysis is based on current structure and probability, not certainty. Trade with discipline, respect your invalidation levels, and manage risk properly.
If you have a coin or altcoin you want analyzed, first hit the like button and then comment its name so I can review it for you.
This is not a trade setup, as it has no precise stop-loss, stop, or target. I do not publish my trade setups here
