🚨 How to Read Price Action Using Moving Averages - TRX Case Study 📊
Moving Averages (MAs) help identify trend direction on the $BTC market. Here’s a simple way to look at them:
🔹 MA50 – short-term trend
Used to track recent momentum. If the price is above, buyers are active.
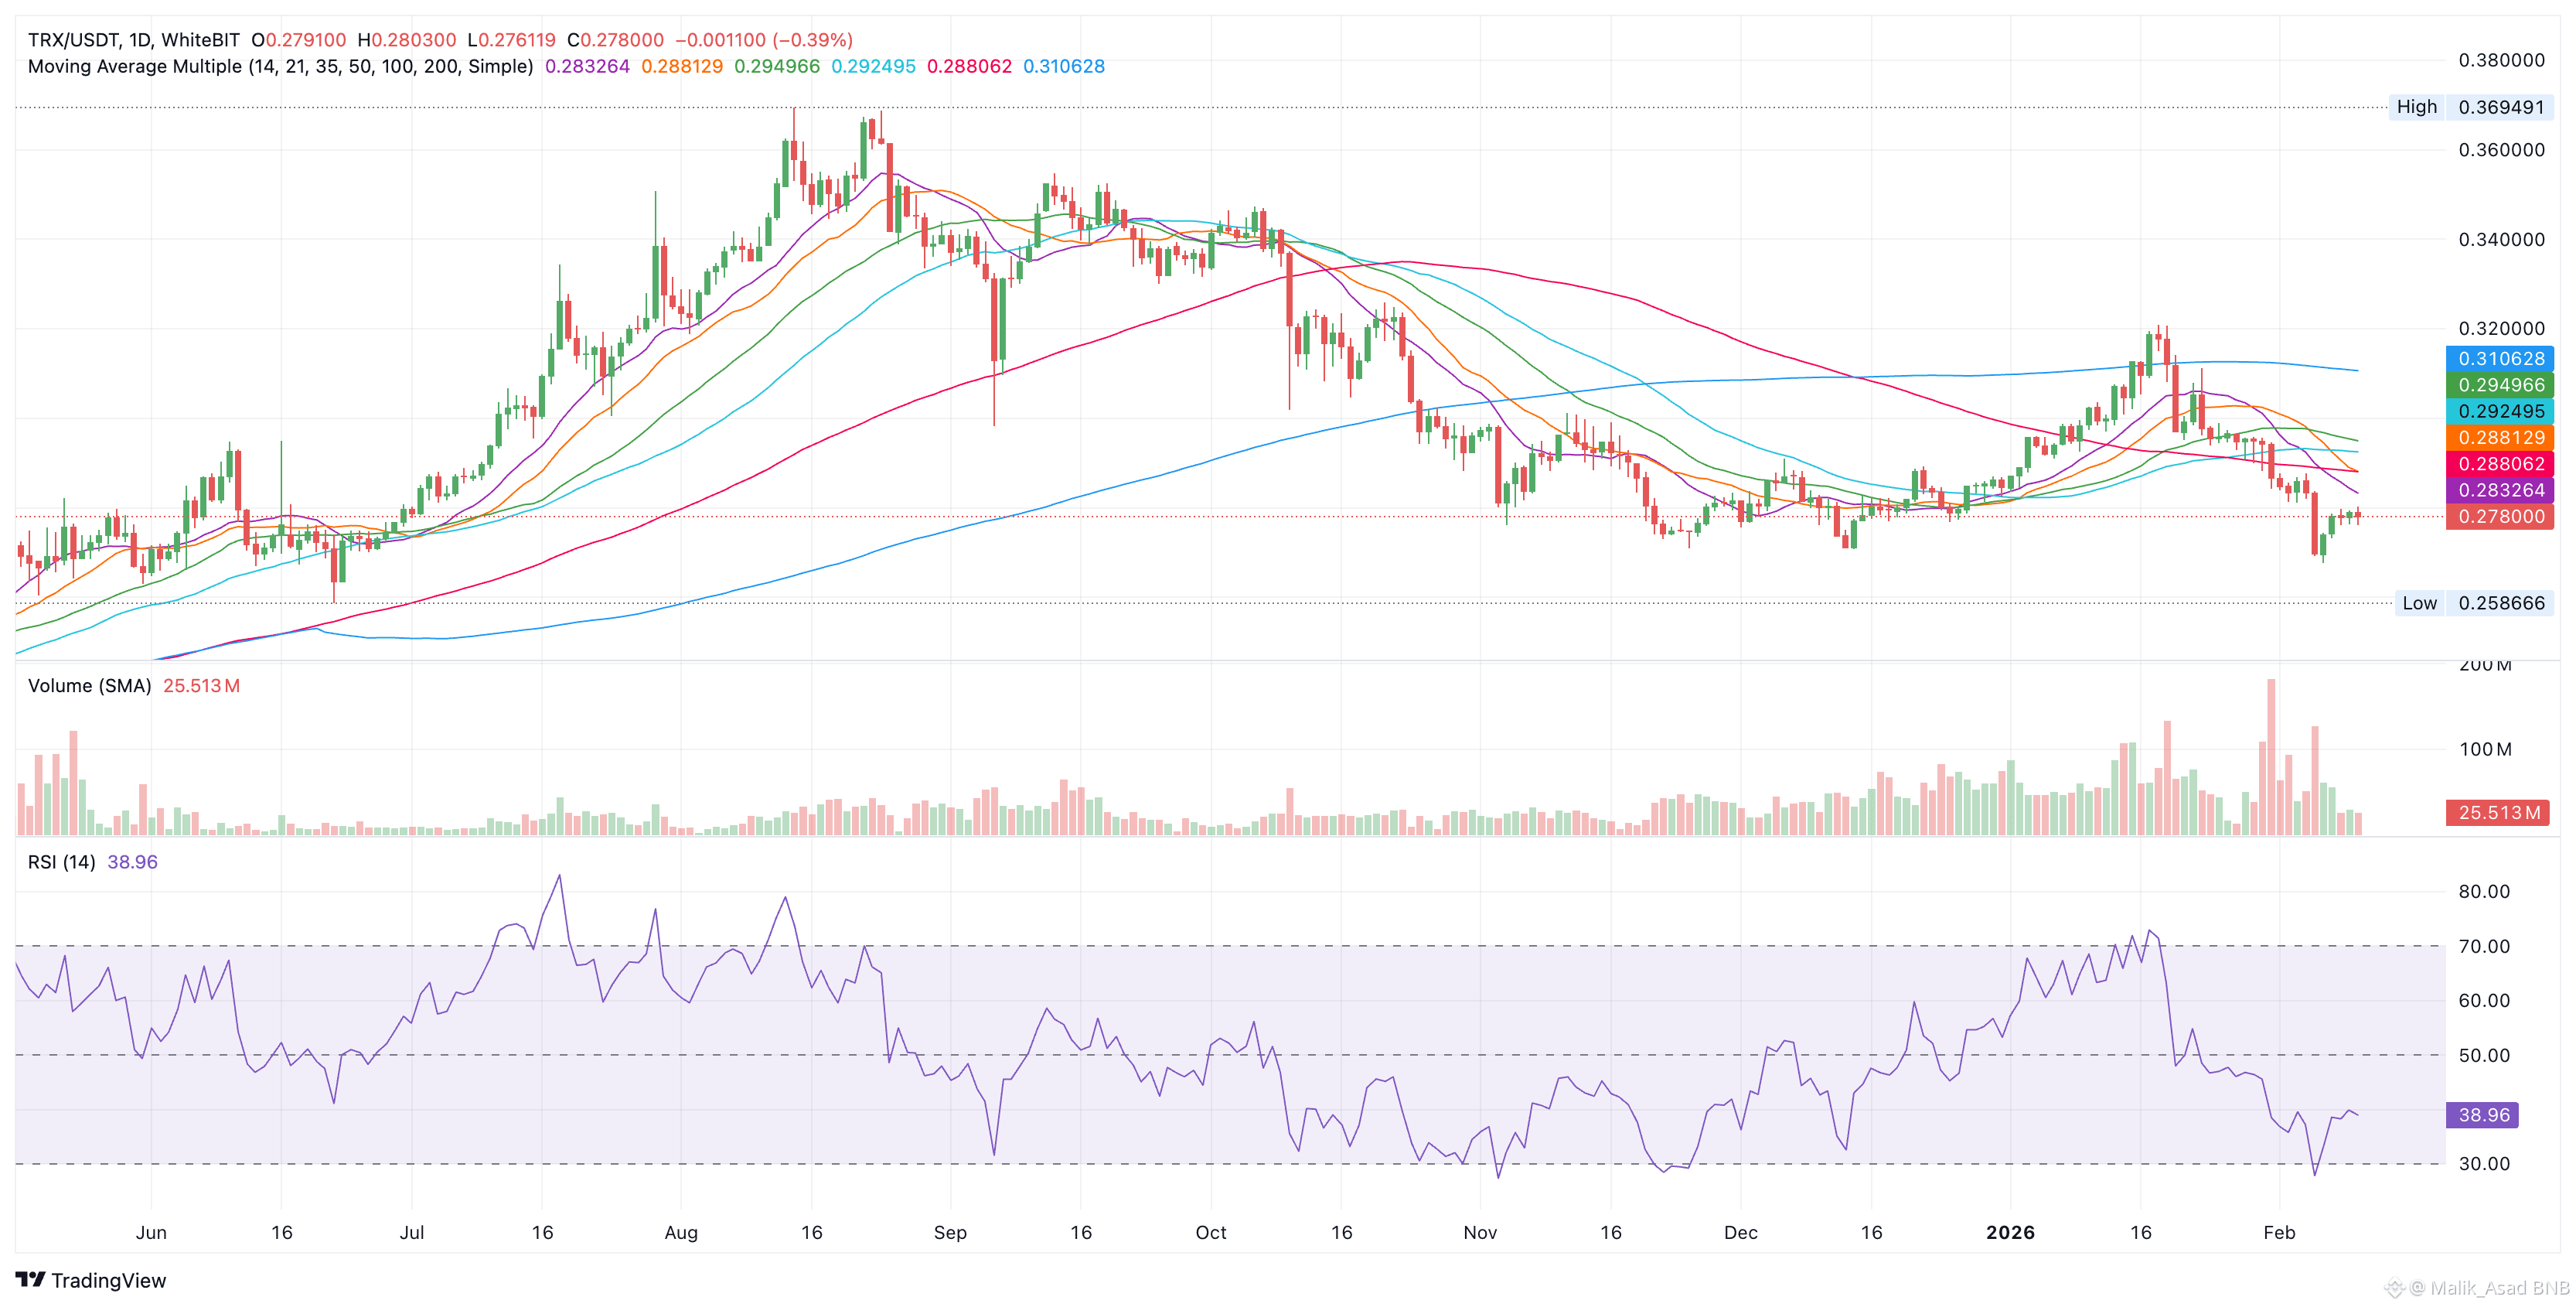
TRX is trading below MA50 (0.292) → weak short-term momentum.
🔹 MA100 – mid-term trend
Shows medium-term control. Crossing below it can suggest deeper correction.
TRX is under MA100 (0.294) - confirms sellers are in control.
🔹 MA200 – long-term trend
Represents overall market direction. Below it = bearish structure.
TRX dropped below MA200 (0.310) weeks ago - not a good sign for long setups.
📉 Current price: 0.278
📈 RSI: 38.96 - slight oversold conditions, but no reversal signal yet.
📊 Volume: 25.5M, stable but no spike in demand.
Conclusion: $TRX remains in a downtrend across all key MAs. No trend shift unless price reclaims MA50 first.
Watch structure and not just levels, my friends.
#BTC Price Analysis# #TRON #TRX
WhiteBIT Chart: TRX/USDT (1D)
Moving Averages (MAs) help identify trend direction on the $BTC market. Here’s a simple way to look at them:
🔹 MA50 – short-term trend
Used to track recent momentum. If the price is above, buyers are active.
TRX is trading below MA50 (0.292) → weak short-term momentum.
🔹 MA100 – mid-term trend
Shows medium-term control. Crossing below it can suggest deeper correction.
TRX is under MA100 (0.294) - confirms sellers are in control.
🔹 MA200 – long-term trend
Represents overall market direction. Below it = bearish structure.
TRX dropped below MA200 (0.310) weeks ago - not a good sign for long setups.
📉 Current price: 0.278
📈 RSI: 38.96 - slight oversold conditions, but no reversal signal yet.
📊 Volume: 25.5M, stable but no spike in demand.
Conclusion: $TRX remains in a downtrend across all key MAs. No trend shift unless price reclaims MA50 first.
Watch structure and not just levels, my friends.
#BTC Price Analysis# #TRON #TRX
WhiteBIT Chart: TRX/USDT (1D)