


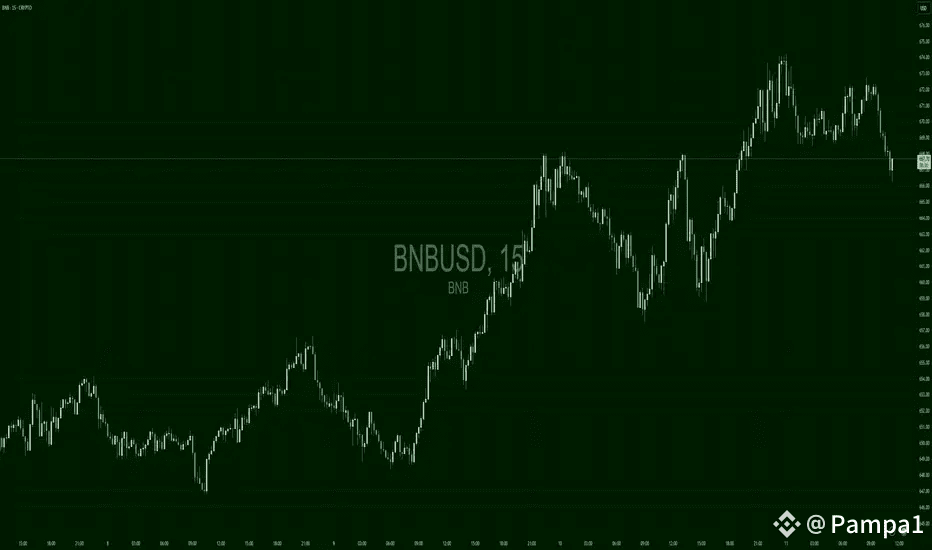
Binance Coin paused near $674–$680, consolidating before what could be its next major move. Let’s break down the setup and what to watch 📊👇
---
✅ Current Price & On‑Chain Momentum
BNB recently rallied ~10%, breaking out above the symmetrical triangle/pennant pattern on May 8—the move paused around $674, where sellers stepped in .
On‑chain indicators are strong: DEX volume hit highs near $11–13B, and stablecoin activity is booming on BNB Chain—signs of growing ecosystem usage .
---
🧭 Chart Structure & Levels
🔨 Zone 📏 Level 📌 Notes
Support ~$668–675 Previous breakout zone—holds key
Immediate Resistance ~$685–692 Watch zone on 4‑hour chart
Key Breakout Level Above ~$700 Would open path to $730–800
Upside Target $732 weekly high → $839 triangle target For disciplined traders
Pullback Risk A drop under $668 → $638 support zone Beware bearish retest
---
📈 Technical & Trend Signals
The EMAs are aligned bullishly on the daily and hourly charts, including the 20/50 and 100-hour averages—a golden cross appeared recently, reinforcing bull compactness .
RSI (~61) remains below overbought levels—suggesting room to grow .
MACD signals remain positive with no major bear crossover yet—momentum is intact .
---
⚙️ Trade Playbook
1. Dip‑Buy Setup
Entry: $670–$675 zone on pullback
Targets: $685 → $700 → $730
Stop‑Loss: < $662 (below recent lows)
2. Breakout Trader
Entry: Close above $700
Targets: $732 → $800
Stop‑Loss: Back under $685
3. Conservative Holders
Strategy: Track support at EMA zones ($650–$670), accumulate gradually with wide stop-losses around $620–$640
---
🚨 Risks & Catalysts
Macro factors like trade tensions and global uncertainty could spark volatility—but BNB has shown resilience in past consolidations .
On‑chain strength with surging DEX and stablecoin usage is bullish—it hints at long-term structural adoption .
Institutional & ETF interest has warmed up to Binance and BNB, adding another positive layer .
---
🎯 Final Verdict
BNB paused nicely after the $674 rally, forming a base for what could be the next upward thrust. Key levels to monitor: $700 breakout or a dip down to $670 provides buying opportunity. Volume confirmation is critical—with momentum indicators still in bullish alignment, the path to $732–$800 remains plausible. Just stay agile and risk-aware! 🧭
---
🎨 For Binance Square Creators: Use clean chart annotations (triangle breakout, key support/resistance, EMA cross), highlight on‑chain and macro stats, and keep tone friendly, concise, and engaging.
---
Disclaimer: Informational only, not financial advice—always do your own research & manage risk.