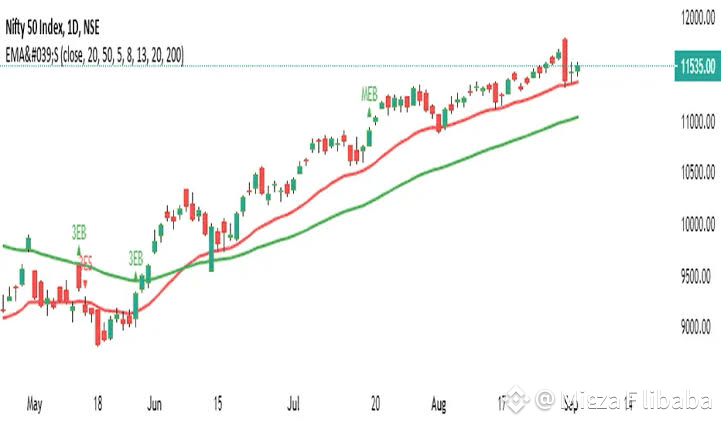
🚨 EMA 20 Crossing EMA 200 — Powerful Trading Signal! 🚨
Traders, listen up!
When the 20 EMA (Exponential Moving Average) crosses the 200 EMA, it's a major signal of a trend shift:
✅ Bullish Signal (Golden Cross): When EMA 20 crosses above EMA 200 → This suggests a possible uptrend. Traders often take this as a sign to enter buy positions.
❌ Bearish Signal (Death Cross): When EMA 20 crosses below EMA 200 → This indicates a potential downtrend. Many traders use this to consider sell positions or avoid buying.
💡 How to Set This Up:
Open your chart on TradingView (or any platform you use).
Add the EMA indicator twice.
Set one EMA to 20 (short-term) — this will react faster.
Set the other EMA to 200 (long-term) — this shows the overall trend.
Watch for crossovers between these two lines!
🎯 Pro Tips to Edit and Improve:
🔄 Try adjusting the EMAs to EMA 50 & EMA 200 if you want slightly smoother and more reliable signals.
⏰ Use this strategy best on higher timeframes like 4H, Daily, or Weekly for stronger confirmation.
🛡️ Combine this with RSI or MACD to filter out false signals.
🚫 Avoid using this strategy on very low timeframes (1 min, 5 min) — crossovers can give fake signals in choppy markets.
👉 Use this crossover strategy to catch big trend moves — but always confirm with other tools and manage your risk!
Happy trading! 📈💪
#tradingtechnique
Traders, listen up!
When the 20 EMA (Exponential Moving Average) crosses the 200 EMA, it's a major signal of a trend shift:
✅ Bullish Signal (Golden Cross): When EMA 20 crosses above EMA 200 → This suggests a possible uptrend. Traders often take this as a sign to enter buy positions.
❌ Bearish Signal (Death Cross): When EMA 20 crosses below EMA 200 → This indicates a potential downtrend. Many traders use this to consider sell positions or avoid buying.
💡 How to Set This Up:
Open your chart on TradingView (or any platform you use).
Add the EMA indicator twice.
Set one EMA to 20 (short-term) — this will react faster.
Set the other EMA to 200 (long-term) — this shows the overall trend.
Watch for crossovers between these two lines!
🎯 Pro Tips to Edit and Improve:
🔄 Try adjusting the EMAs to EMA 50 & EMA 200 if you want slightly smoother and more reliable signals.
⏰ Use this strategy best on higher timeframes like 4H, Daily, or Weekly for stronger confirmation.
🛡️ Combine this with RSI or MACD to filter out false signals.
🚫 Avoid using this strategy on very low timeframes (1 min, 5 min) — crossovers can give fake signals in choppy markets.
👉 Use this crossover strategy to catch big trend moves — but always confirm with other tools and manage your risk!
Happy trading! 📈💪
#tradingtechnique