
The second cheat sheet for you today!
This is a cheat sheet for divergences defining between the price and oscillator. As the oscillator the RSI , Stochastic , MFI , CCI , MACD and other indicators can be used (see chart 1).
Regular Bullish Divergence The price shows lower lows, oscillator - higher lows. This is the sign of downtrend weakness and potential reverse to the uptrend.
Regular Bearish Divergence The price shows higher highs, oscillator - lower highs. This is the sign of the potential reverse from the uptrend to the downtrend.
Hidden Bullish Divergence The price shows highers lows, oscillator - lower highs. This is the uptrend strength sign, it is going to continue.
Hidden Bearish Divergence The price shows lower highs, oscillator higher highs. This is the downtrend strength sign, it is going to continue.
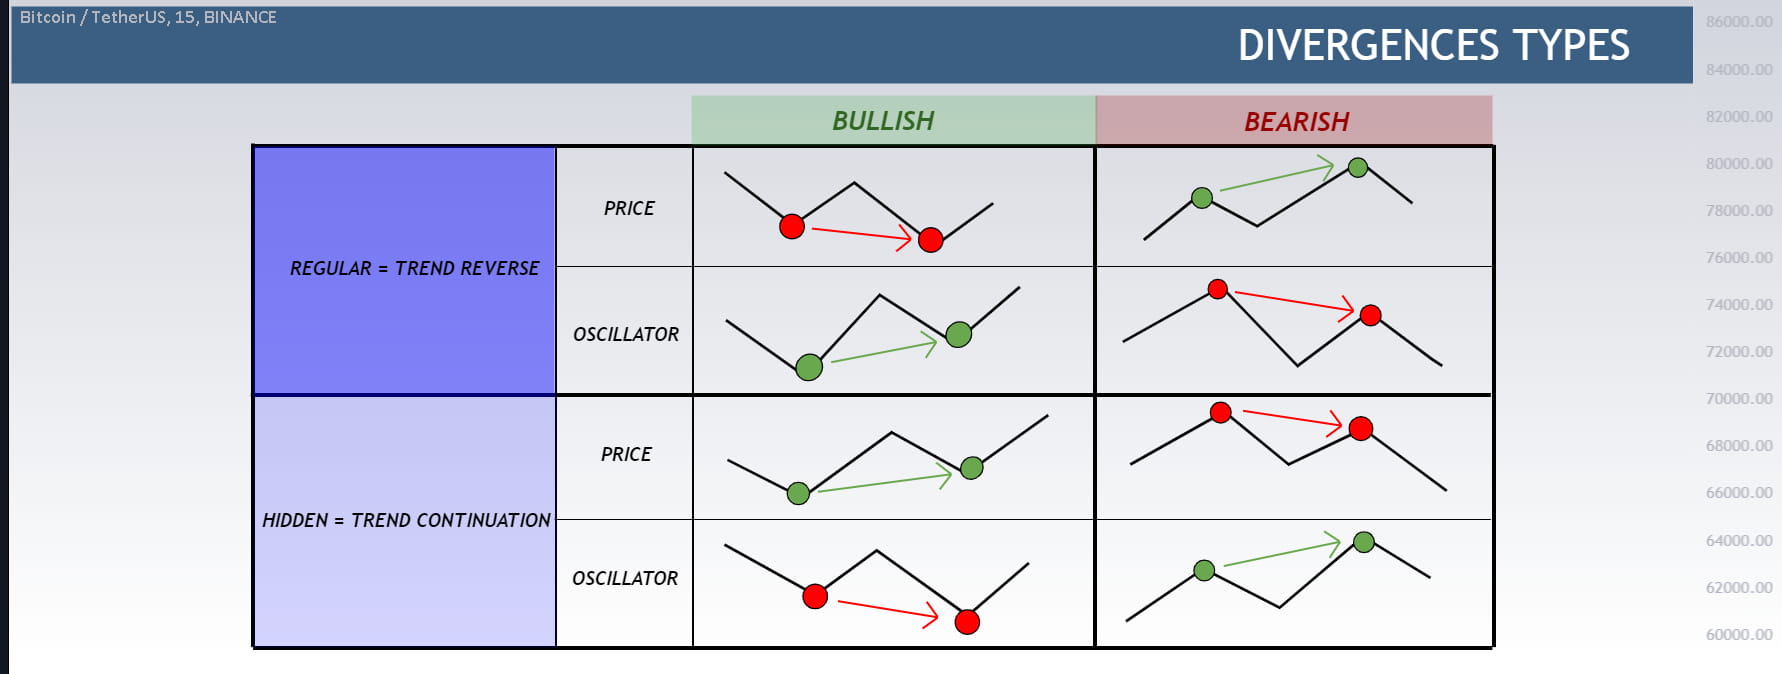
Chart 1. Divergences
Not a financial advice. #dyor #crypto2023 #divergence