


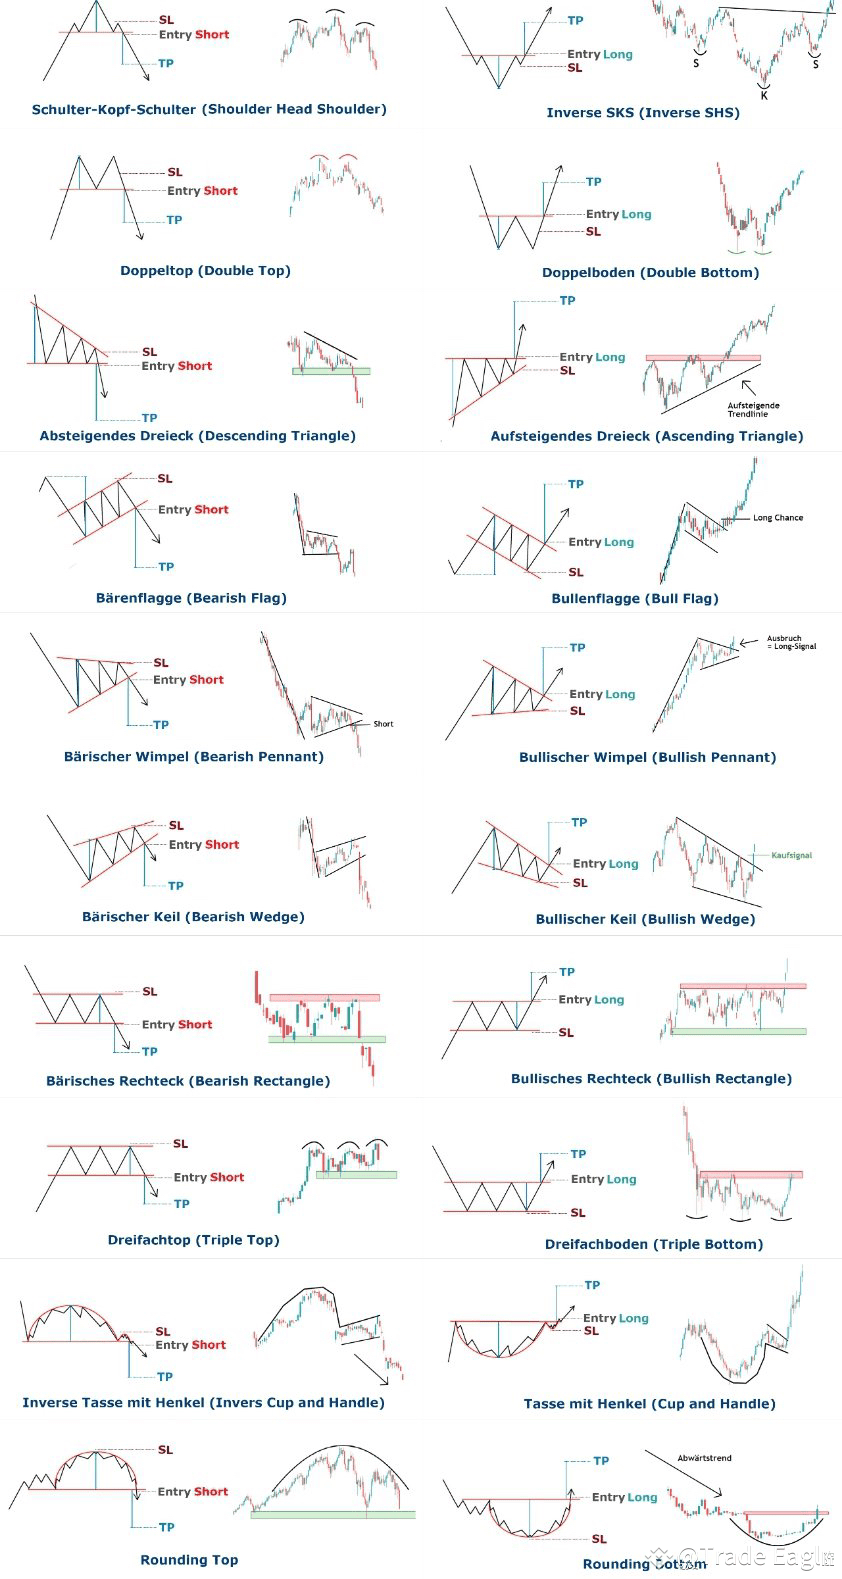
 1. Head and Shoulders (Bearish Reversal)
- Description: A bearish reversal pattern that forms after an uptrend. It consists of three peaks, with the middle one (head) being the highest and the two side peaks (shoulders) being lower.
- Trading Strategy:
- Entry: When the price breaks below the "neckline."
- Stop-Loss (SL): Above the right shoulder.
- Take-Profit (TP): Measured from the neckline to the top of the head.
2. Inverse Head and Shoulders (Bullish Reversal)
- Description: A bullish reversal pattern appearing after a downtrend. It has a similar structure to the Head and Shoulders but inverted.
- Trading Strategy:
- Entry: When the price breaks above the neckline.
- SL: Below the right shoulder.
- TP: Measured from the neckline to the bottom of the head.
---
3. Double Top (Bearish Reversal)
- Description: A pattern with two peaks at a similar level, indicating a potential reversal from an uptrend.
- Trading Strategy:
- Entry: When the price breaks below the support level (neckline).
- SL: Above the peaks.
- TP: Height of the formation from peak to neckline.
4. Double Bottom (Bullish Reversal)
- Description: The opposite of a double top, this pattern has two troughs, suggesting a potential reversal from a downtrend.
- Trading Strategy:
- Entry: When the price breaks above the resistance level (neckline).
- SL: Below the troughs.
- TP: Height of the pattern.
---
5. Descending Triangle (Bearish Continuation)
- Description: A bearish pattern with a descending trendline and horizontal support.
- Trading Strategy:
- Entry: When the price breaks below the horizontal support.
- SL: Above the descending trendline.
- TP: Equal to the height of the triangle.
6. Ascending Triangle (Bullish Continuation)
- Description: A bullish pattern with an ascending trendline and horizontal resistance.
- Trading Strategy:
- Entry: When the price breaks above the horizontal resistance.
- SL: Below the ascending trendline.
- TP: Equal to the height of the triangle.
---
7. Bearish Flag (Bearish Continuation)
- Description: A downward-sloping consolidation after a sharp downward move.
- Trading Strategy:
- Entry: When the price breaks below the flag’s lower boundary.
- SL: Above the flag’s upper boundary.
- TP: Equal to the initial flagpole height.
8. Bullish Flag (Bullish Continuation)
- Description: An upward-sloping consolidation after a strong upward move.
- Trading Strategy:
- Entry: When the price breaks above the flag’s upper boundary.
- SL: Below the flag’s lower boundary.
- TP: Equal to the initial flagpole height.
---
9. Bearish Pennant (Bearish Continuation)
- Description: A small symmetrical triangle following a strong downtrend.
- Trading Strategy:
- Entry: When the price breaks below the pennant’s lower boundary.
- SL: Above the pennant.
- TP: Equal to the initial downward move.
10. Bullish Pennant (Bullish Continuation)
- Description: A small symmetrical triangle following a strong uptrend.
- Trading Strategy:
- Entry: When the price breaks above the pennant’s upper boundary.
- SL: Below the pennant.
- TP: Equal to the initial upward move.
---
11. Bearish Wedge (Bearish Continuation)
- Description: A rising wedge pattern that signals a potential breakdown.
- Trading Strategy:
- Entry: When the price breaks below the wedge.
- SL: Above the wedge’s resistance.
- TP: Equal to the wedge’s height.
12. Bullish Wedge (Bullish Continuation)
- Description: A falling wedge that signals a potential breakout.
- Trading Strategy:
- Entry: When the price breaks above the wedge.
- SL: Below the wedge’s support.
- TP: Equal to the wedge’s height.
---
13. Bearish Rectangle (Bearish Continuation)
- Description: A price consolidation between horizontal support and resistance in a downtrend.
- Trading Strategy:
- Entry: When the price breaks below support.
- SL: Above resistance.
- TP: Equal to the rectangle’s height.
14. Bullish Rectangle (Bullish Continuation)
- Description: A price consolidation between horizontal support and resistance in an uptrend.
- Trading Strategy:
- Entry: When the price breaks above resistance.
- SL: Below support.
- TP: Equal to the rectangle’s height.
---
15. Triple Top (Bearish Reversal)
- Description: Similar to a double top but with three peaks.
- Trading Strategy:
- Entry: When the price breaks below the neckline.
- SL: Above the peaks.
- TP: Equal to the pattern’s height.
16. Triple Bottom (Bullish Reversal)
- Description: Similar to a double bottom but with three troughs.
- Trading Strategy:
- Entry: When the price breaks above the neckline.
- SL: Below the troughs.
- TP: Equal to the pattern’s height.
---
17. Inverse Cup and Handle (Bearish Continuation)
- Description: A rounded top (cup) followed by a small upward retracement (handle), indicating a potential breakdown.
- Trading Strategy:
- Entry: When the price breaks below the handle.
- SL: Above the handle.
- TP: Equal to the cup’s height.
18. Cup and Handle (Bullish Continuation)
- Description: A rounded bottom (cup) followed by a small downward retracement (handle), indicating a potential breakout.
- Trading Strategy:
- Entry: When the price breaks above the handle.
- SL: Below the handle.
- TP: Equal to the cup’s height.
---
19. Rounding Top (Bearish Reversal)
- Description: A slow transition from bullish to bearish momentum, forming a rounded shape at the top.
- Trading Strategy:
- Entry: When the price breaks below support.
- SL: Above the rounding top.
- TP: Measured by the height of the pattern.
20. Rounding Bottom (Bullish Reversal)
- Description: A slow transition from bearish to bullish momentum, forming a rounded shape at the bottom.
- Trading Strategy:
- Entry: When the price breaks above resistance.
- SL: Below the rounding bottom.
- TP: Measured by the height of the pattern.