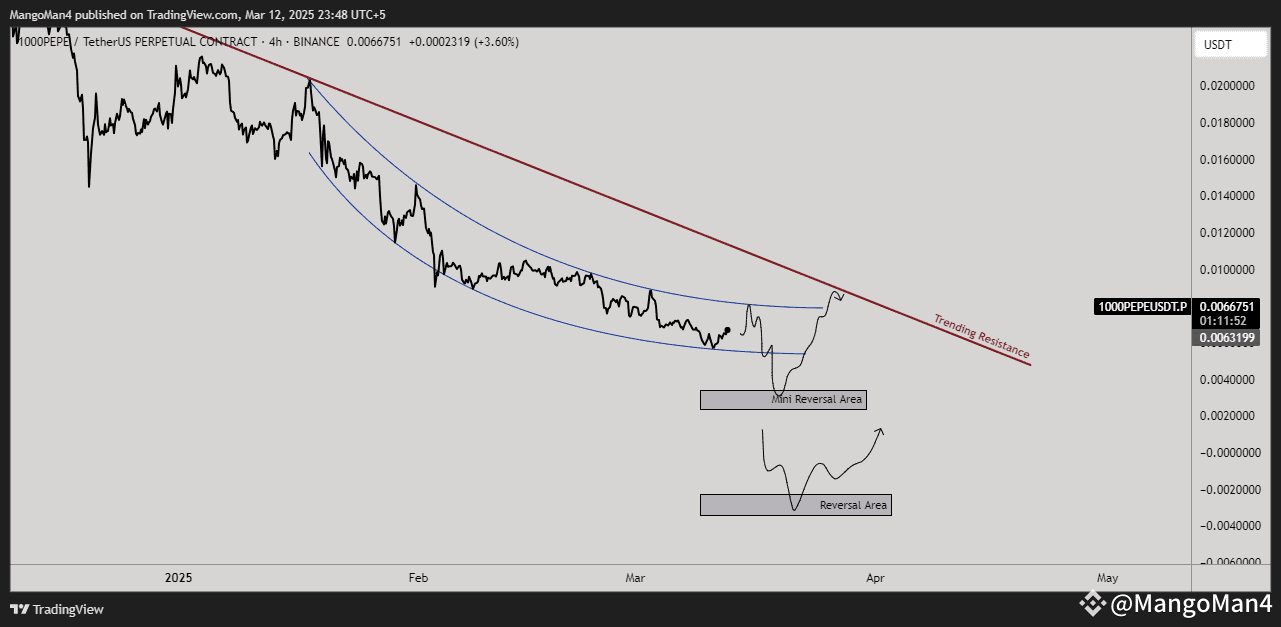
PEPEUSDT Technical Analysis – March 12, 2025
🔹 Current Price: $0.0066751
🔹 Timeframe: 4-Hour Chart
🔹 Market Structure: Falling wedge breakout with resistance ahead
📊 Analysis:
1000PEPE has been in a prolonged downtrend, forming a falling wedge pattern. This is generally a bullish reversal structure, and recent price action suggests that momentum is shifting. However, there is a major trendline resistance (red) ahead that could act as a barrier for further upside.
📉 Bearish Scenario:
🔻 If the price gets rejected at the trendline resistance, a pullback towards the Mini Reversal Area ($0.0045 - $0.0050) is likely.
🔻 A deeper correction could push the price down to the Reversal Area ($0.0025 - $0.0035) before a potential bounce.
🔻 Failing to hold the Reversal Area could lead to further downside.
📈 Bullish Scenario:
✅ If 1000PEPE breaks above the red trendline resistance, it could trigger a strong breakout toward $0.010 - $0.012.
✅ A successful retest of the breakout level would confirm bullish strength.
✅ Watch for higher lows and increased volume for confirmation.
🚨 Key Levels to Watch:
🔹 Resistance: $0.0075 (trendline), $0.010
🔹 Support: $0.0045 (mini reversal area), $0.0025 (major support)
📢 Final Thoughts:
1000PEPE is at a critical decision point! If bulls manage to break the trendline resistance, expect a strong rally. Otherwise, a pullback to lower support levels is likely. Patience is key—watch how price reacts!
🔔 Follow for more crypto insights and trading setups! 🚀
🔹 Current Price: $0.0066751
🔹 Timeframe: 4-Hour Chart
🔹 Market Structure: Falling wedge breakout with resistance ahead
📊 Analysis:
1000PEPE has been in a prolonged downtrend, forming a falling wedge pattern. This is generally a bullish reversal structure, and recent price action suggests that momentum is shifting. However, there is a major trendline resistance (red) ahead that could act as a barrier for further upside.
📉 Bearish Scenario:
🔻 If the price gets rejected at the trendline resistance, a pullback towards the Mini Reversal Area ($0.0045 - $0.0050) is likely.
🔻 A deeper correction could push the price down to the Reversal Area ($0.0025 - $0.0035) before a potential bounce.
🔻 Failing to hold the Reversal Area could lead to further downside.
📈 Bullish Scenario:
✅ If 1000PEPE breaks above the red trendline resistance, it could trigger a strong breakout toward $0.010 - $0.012.
✅ A successful retest of the breakout level would confirm bullish strength.
✅ Watch for higher lows and increased volume for confirmation.
🚨 Key Levels to Watch:
🔹 Resistance: $0.0075 (trendline), $0.010
🔹 Support: $0.0045 (mini reversal area), $0.0025 (major support)
📢 Final Thoughts:
1000PEPE is at a critical decision point! If bulls manage to break the trendline resistance, expect a strong rally. Otherwise, a pullback to lower support levels is likely. Patience is key—watch how price reacts!
🔔 Follow for more crypto insights and trading setups! 🚀