Bitcoin (BTC) Technical Analysis – March 12, 2025
🔹 Current Price: $81,947.9
🔹 Timeframe: 30-Minute Chart
🔹 Market Structure: Parabolic curve breakdown, potential support zone
📊 Analysis:
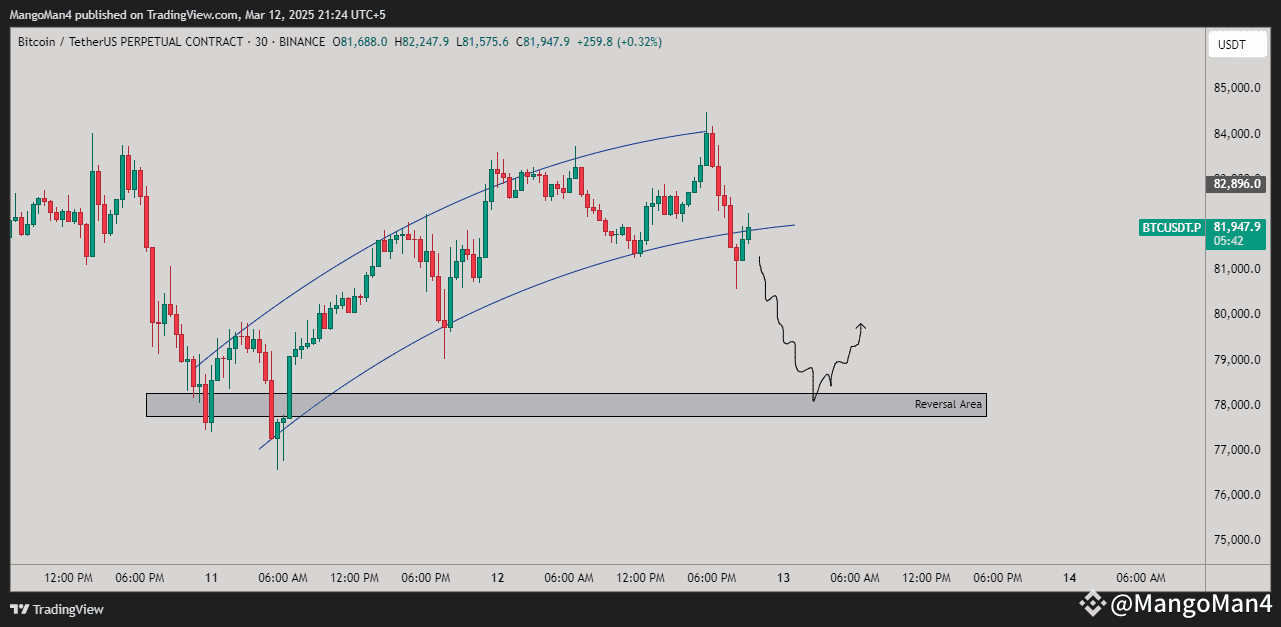
Bitcoin recently formed a parabolic ascending structure, but has now broken below the curve, signaling a potential trend shift. The price is currently testing a key support zone, and if it fails to hold, a drop towards the $78,000 - $79,000 Reversal Area could be expected.
📉 Bearish Scenario:
🔻 BTC has broken below the curved support, confirming weakness.
🔻 If rejection happens near $82,000, price may continue to drop toward $78,000.
🔻 Watch for a reaction at the Reversal Area (gray zone).
📈 Bullish Scenario:
✅ A bounce from the $78,000 - $79,000 level could provide a long opportunity.
✅ Confirmation of higher lows and bullish volume could indicate a strong recovery.
✅ Breaking back above $82,500 may invalidate the bearish outlook.
🚨 Key Levels to Watch:
🔹 Support: $78,000 - $79,000
🔹 Resistance: $82,500 - $83,000
📢 Final Thoughts:
Traders should watch price action at the Reversal Area to determine the next big move. If BTC finds strong demand at support, a reversal is likely, otherwise, further downside could continue.
🔔 Follow for more live updates and trade setups! 🚀
🔹 Current Price: $81,947.9
🔹 Timeframe: 30-Minute Chart
🔹 Market Structure: Parabolic curve breakdown, potential support zone
📊 Analysis:
Bitcoin recently formed a parabolic ascending structure, but has now broken below the curve, signaling a potential trend shift. The price is currently testing a key support zone, and if it fails to hold, a drop towards the $78,000 - $79,000 Reversal Area could be expected.
📉 Bearish Scenario:
🔻 BTC has broken below the curved support, confirming weakness.
🔻 If rejection happens near $82,000, price may continue to drop toward $78,000.
🔻 Watch for a reaction at the Reversal Area (gray zone).
📈 Bullish Scenario:
✅ A bounce from the $78,000 - $79,000 level could provide a long opportunity.
✅ Confirmation of higher lows and bullish volume could indicate a strong recovery.
✅ Breaking back above $82,500 may invalidate the bearish outlook.
🚨 Key Levels to Watch:
🔹 Support: $78,000 - $79,000
🔹 Resistance: $82,500 - $83,000
📢 Final Thoughts:
Traders should watch price action at the Reversal Area to determine the next big move. If BTC finds strong demand at support, a reversal is likely, otherwise, further downside could continue.
🔔 Follow for more live updates and trade setups! 🚀