ETH/USDT Perpetual Futures Analysis – March 11, 2025
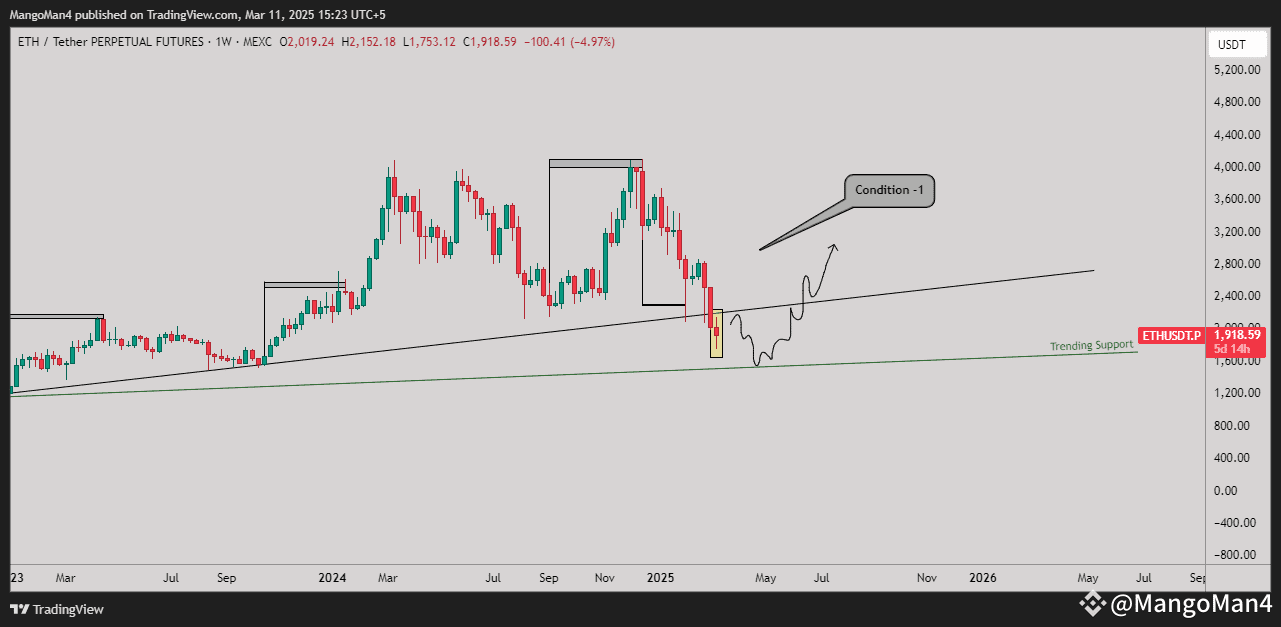
Condition 1: Weekly Support and Potential Rebound
ETH/USDT is currently trading at $1,918.59, with a recent low of $1,753.12.
The price has reached a critical trendline support that has been respected since early 2023.
A bullish rejection is forming near this trendline, with a wick indicating buying pressure from the demand zone.
If ETH maintains this level and confirms a reversal, the next potential resistance targets are:
$2,400 (previous support turned resistance)
$3,000 (major psychological level and structural resistance)
Bullish Confirmation:
A daily close above $2,000 would strengthen the bullish outlook.
Breaking above the trendline retest area around $2,400 would indicate strong momentum.
Bearish Risk:
Losing support at $1,750 could invalidate this scenario and send ETH toward $1,500, aligning with the next major support.
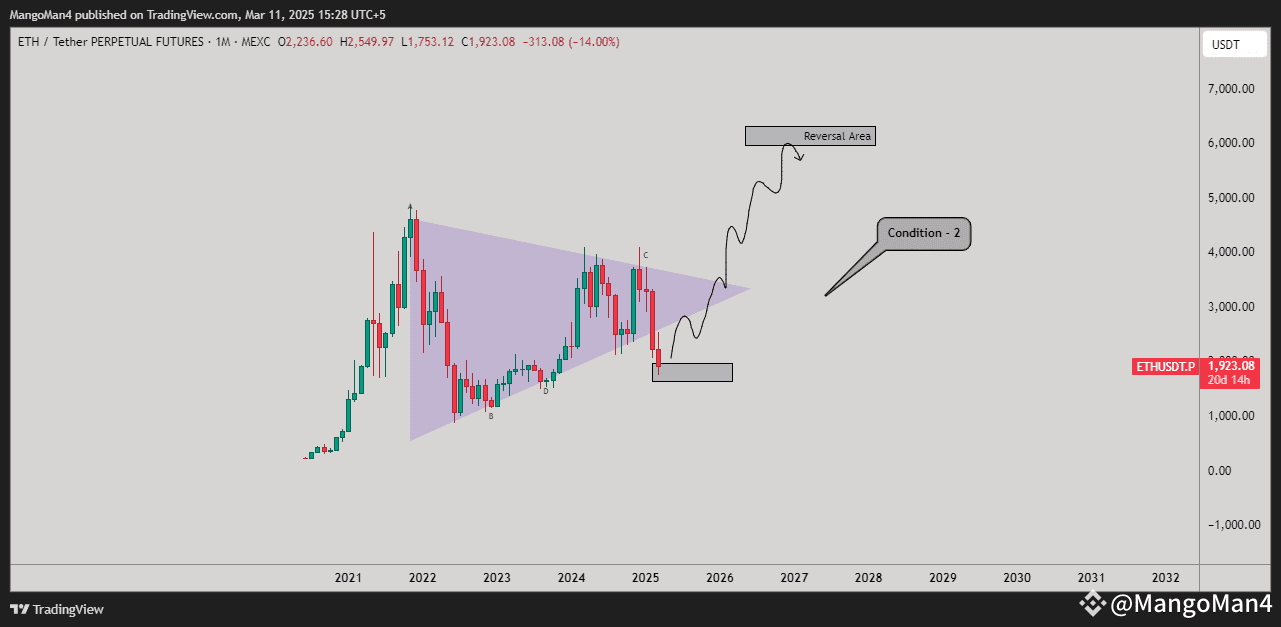
Condition 2: Monthly Triangle Breakout & Long-Term Target
On the monthly timeframe, ETH/USDT has broken out of a symmetrical triangle pattern.
The breakdown has led to a retest of the $1,750-$1,800 demand zone.
If this zone holds, a strong rebound could push ETH toward the reversal area near $6,000 over the next market cycle.
Bullish Pathway:
A confirmed rebound and close above $2,500 could trigger a long-term recovery.
Breaking $3,500 would signal the start of a bullish rally toward $5,000-$6,000.
Bearish Risk:
A failure to hold the $1,750 level could trigger further declines toward $1,500-$1,200 before any potential recovery.
Conclusion
Both conditions suggest ETH/USDT is at a pivotal support level. The next few weeks will determine whether a strong recovery begins or further downside is expected. Traders should watch for confirmations near $2,000-$2,500 for a bullish continuation or prepare for further dips if support fails.
#ETH
Condition 1: Weekly Support and Potential Rebound
ETH/USDT is currently trading at $1,918.59, with a recent low of $1,753.12.
The price has reached a critical trendline support that has been respected since early 2023.
A bullish rejection is forming near this trendline, with a wick indicating buying pressure from the demand zone.
If ETH maintains this level and confirms a reversal, the next potential resistance targets are:
$2,400 (previous support turned resistance)
$3,000 (major psychological level and structural resistance)
Bullish Confirmation:
A daily close above $2,000 would strengthen the bullish outlook.
Breaking above the trendline retest area around $2,400 would indicate strong momentum.
Bearish Risk:
Losing support at $1,750 could invalidate this scenario and send ETH toward $1,500, aligning with the next major support.
Condition 2: Monthly Triangle Breakout & Long-Term Target
On the monthly timeframe, ETH/USDT has broken out of a symmetrical triangle pattern.
The breakdown has led to a retest of the $1,750-$1,800 demand zone.
If this zone holds, a strong rebound could push ETH toward the reversal area near $6,000 over the next market cycle.
Bullish Pathway:
A confirmed rebound and close above $2,500 could trigger a long-term recovery.
Breaking $3,500 would signal the start of a bullish rally toward $5,000-$6,000.
Bearish Risk:
A failure to hold the $1,750 level could trigger further declines toward $1,500-$1,200 before any potential recovery.
Conclusion
Both conditions suggest ETH/USDT is at a pivotal support level. The next few weeks will determine whether a strong recovery begins or further downside is expected. Traders should watch for confirmations near $2,000-$2,500 for a bullish continuation or prepare for further dips if support fails.
#ETH