
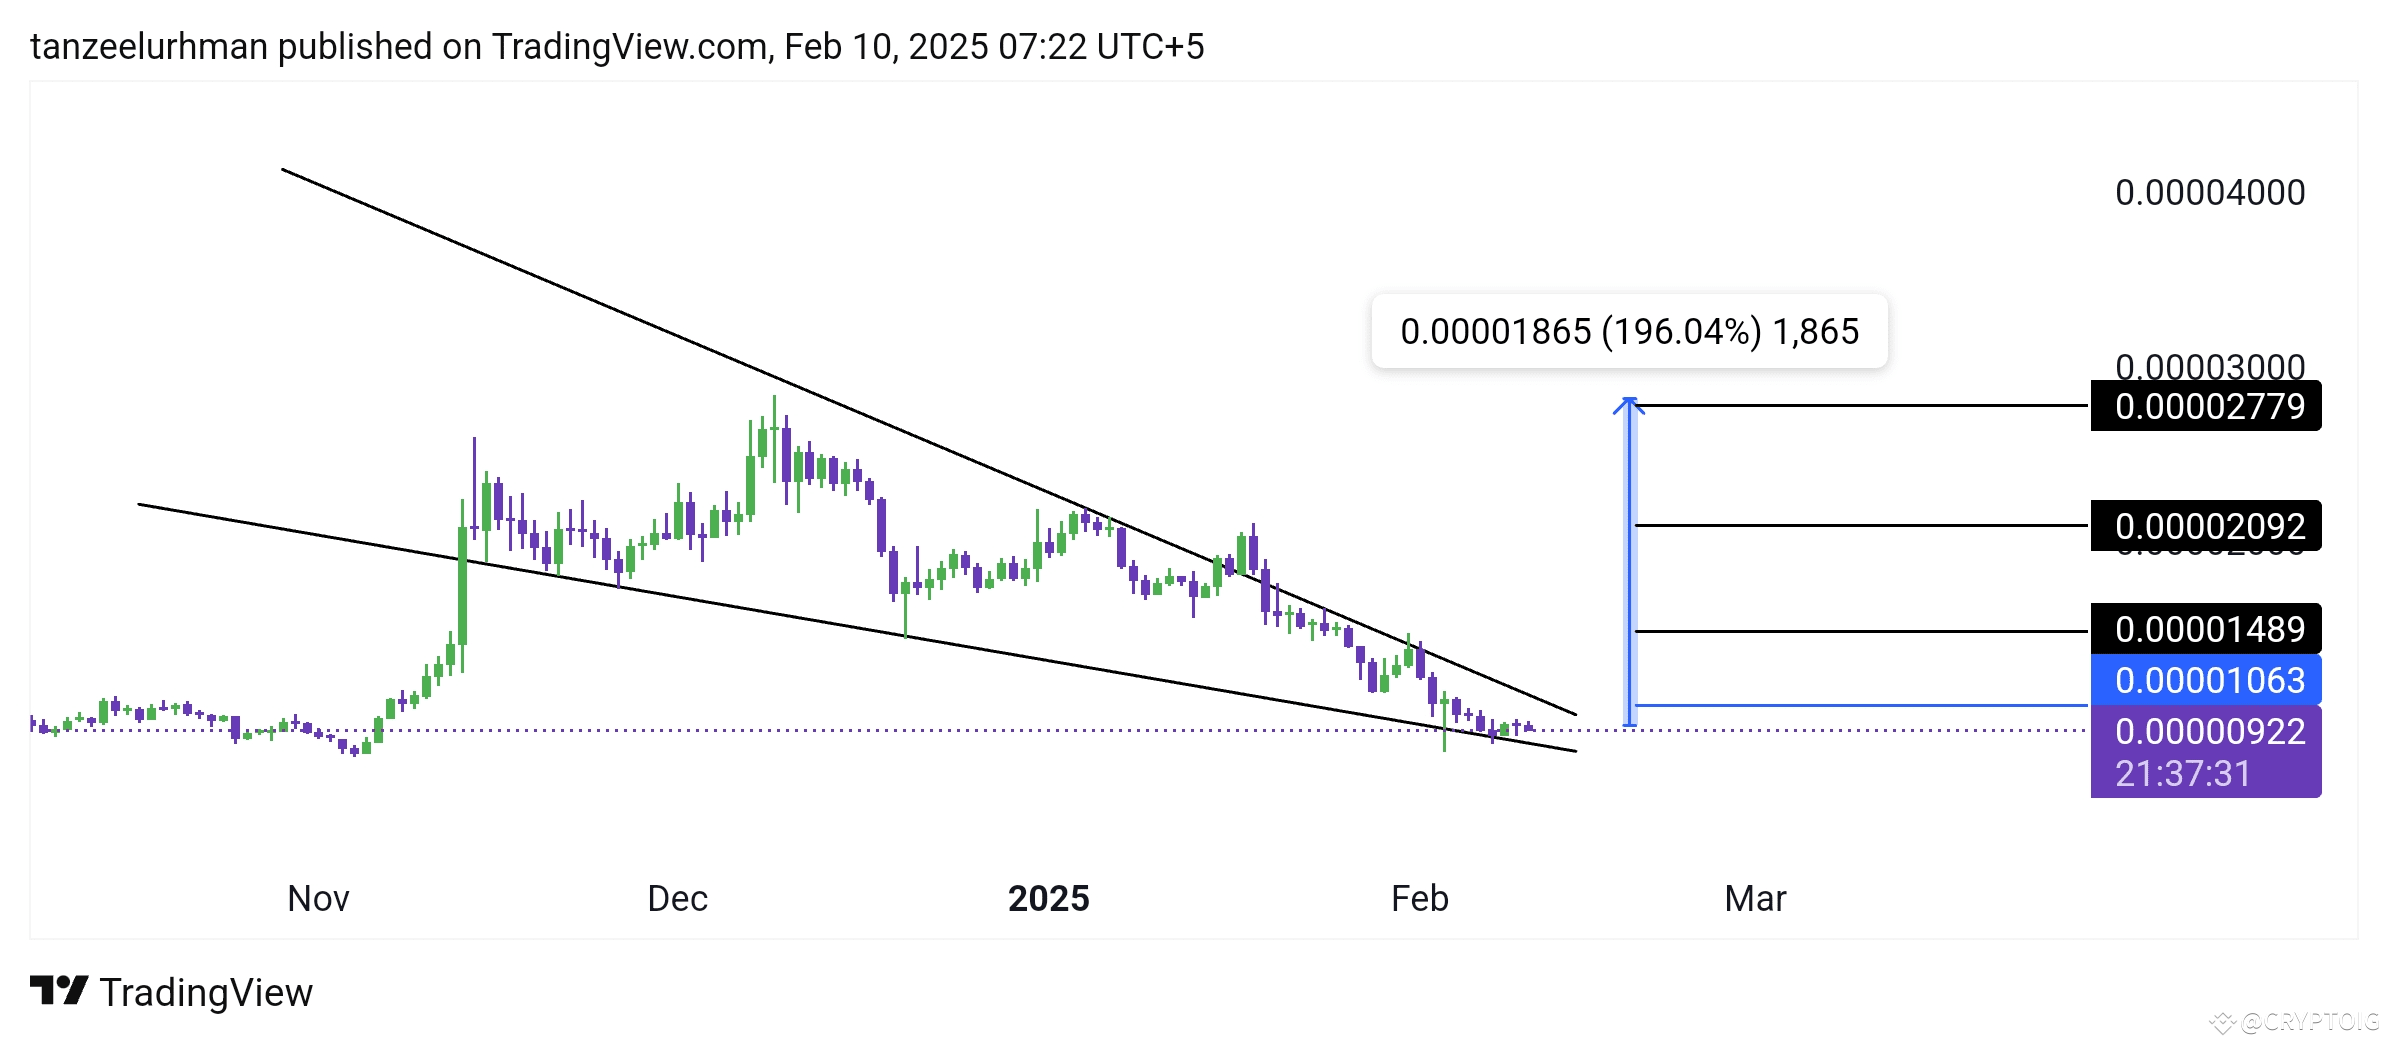
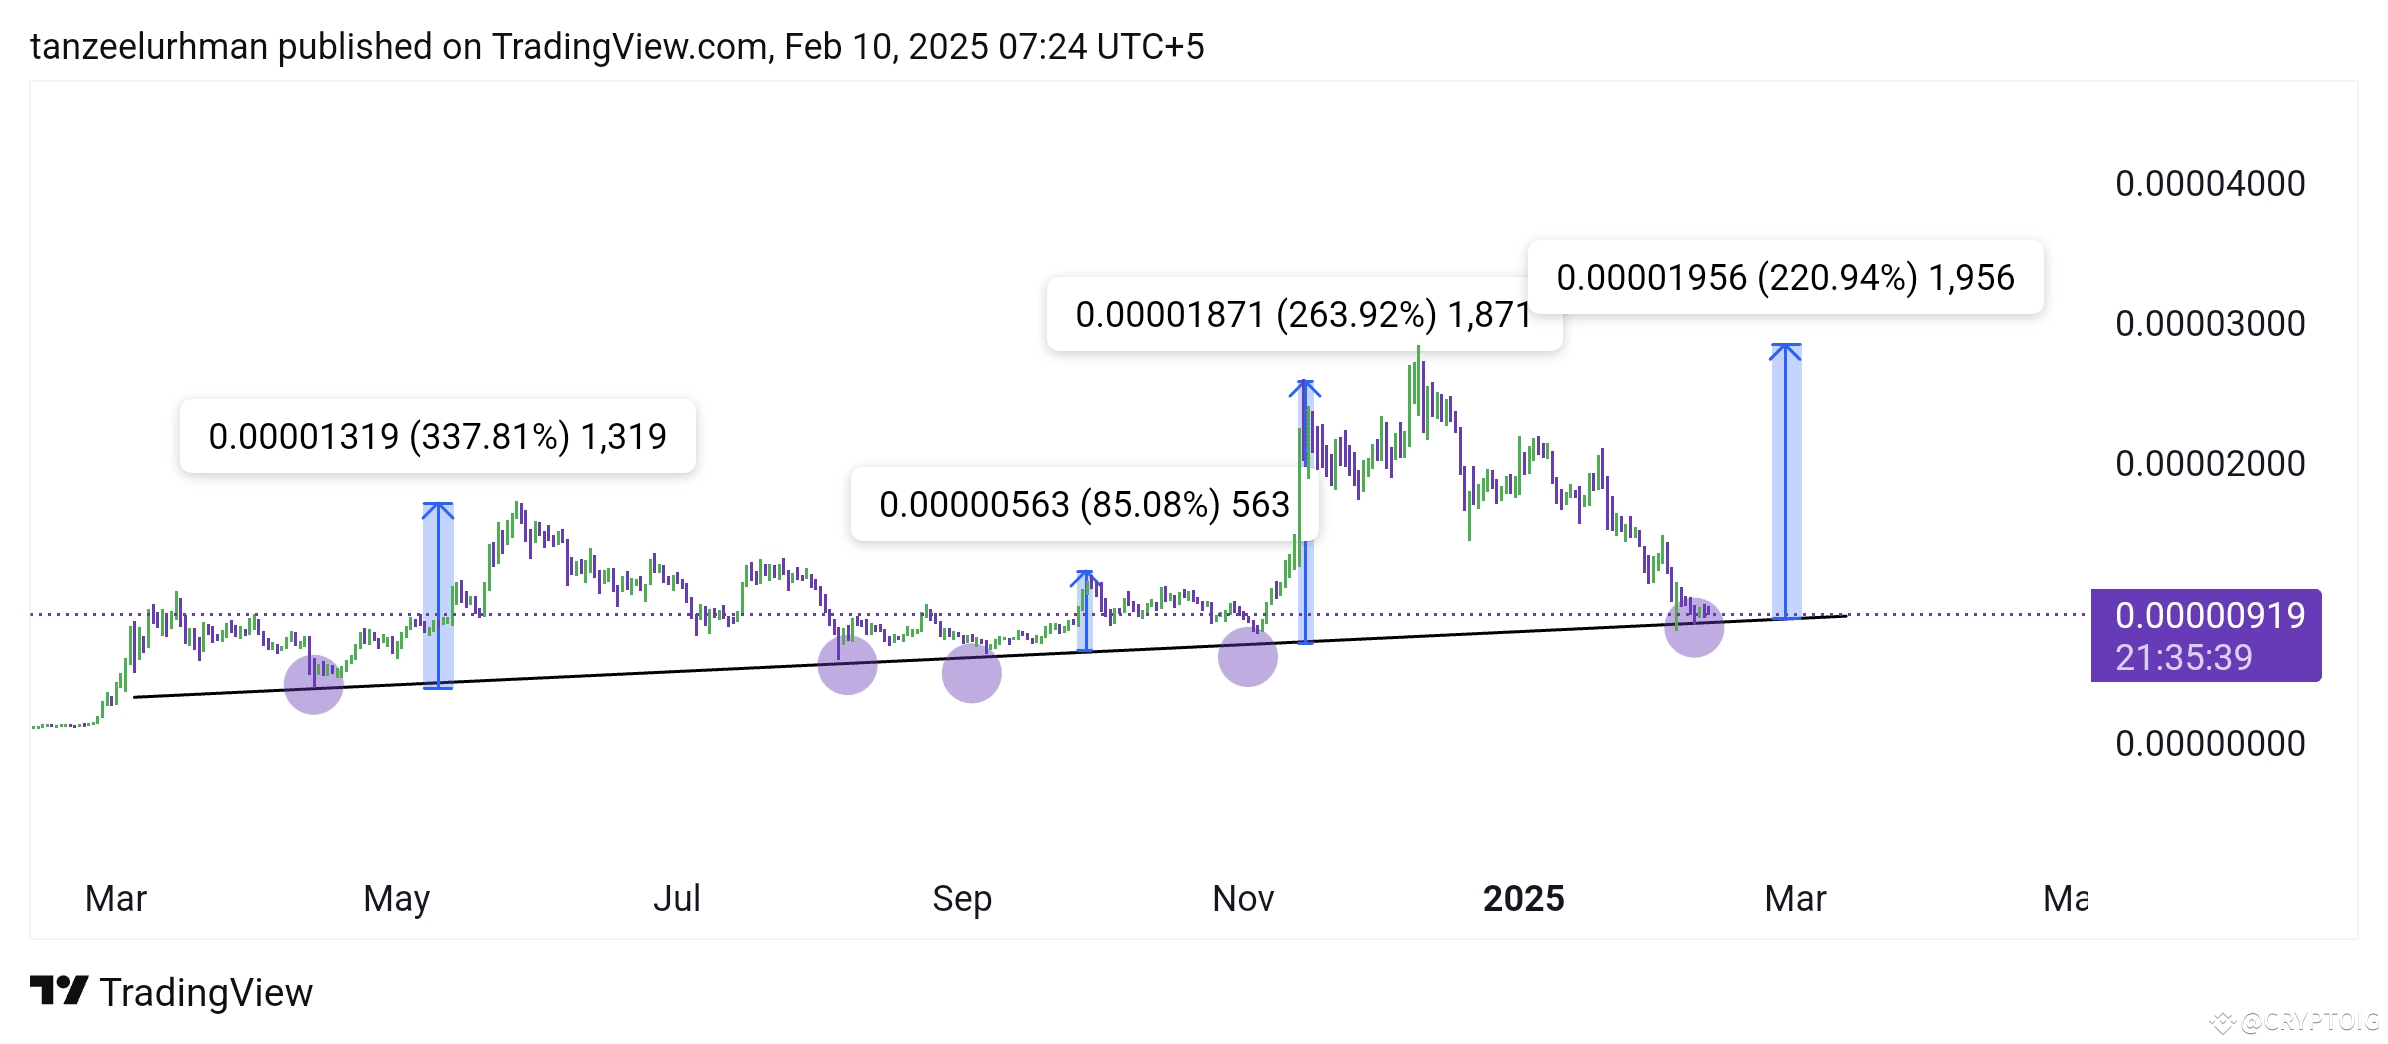
$PEPE The 1-day time frame chart of Pepe is currently moving towards its all-time strong support level and a bullish pattern is also visible on it. If we look at its old chart of a few days, we get to see that whenever the market comes to this support level, then there is a bullish move of more than 100% in the market. It is possible that something like this happens this time too and we get to see a bullish trend in the market.
POSITION MENTION THE CHART 👇
BLUE ENTER 🔵 // BLACK TP ⚫

PEPE
0.0₅408
+2.00%