---$BAL
BAL/USDT Technical Analysis: A Potential Upside?
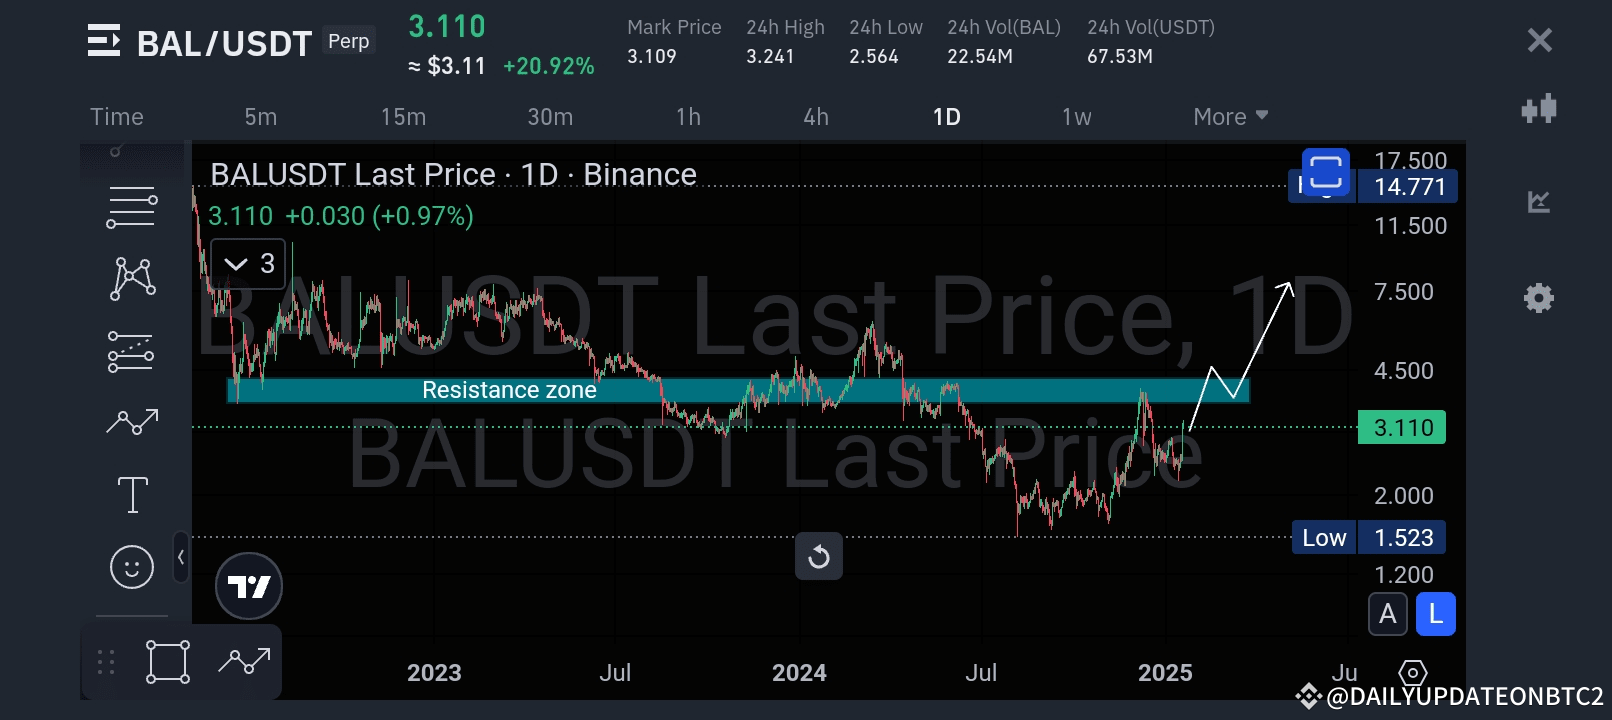
Looking at the BAL/USDT daily chart, the price currently sits at $3.11, showing a 0.97% increase. Here's a breakdown of the key observations and insights:
Key Levels:
1. Resistance Zone: The chart highlights a strong resistance zone, where the price has historically struggled to break through. This zone is critical for any bullish momentum.
2. Support Level: The $1.523 mark stands as the recent low, offering a reliable support base.
Potential Movement:
Based on the current setup:
If the price manages to break through the resistance zone, a strong bullish rally might push it toward the $7.50-$8.00 range.
The marked arrow trajectory indicates that the price could consolidate within the resistance zone before making a decisive breakout.
Market Indicators:
Volume Surge: With a 24-hour trading volume of 67.53M, the activity indicates growing interest in BAL.
Key Metrics: The 24H high of $3.24 and low of $2.56** show a wide trading range, hinting at increasing volatility.
Investor Takeaway:
This setup might appeal to swing traders and long-term investors alike:
Bullish Scenario: A confirmed breakout above the resistance zone could signal a rally toward higher levels, aligning with the arrow's projection.
Risk Factor: However, failing to breach resistance might result in a pullback to test lower levels near $2.50-$2.00.
---