$CTXC /USDT Professional Analysis🔥🔥
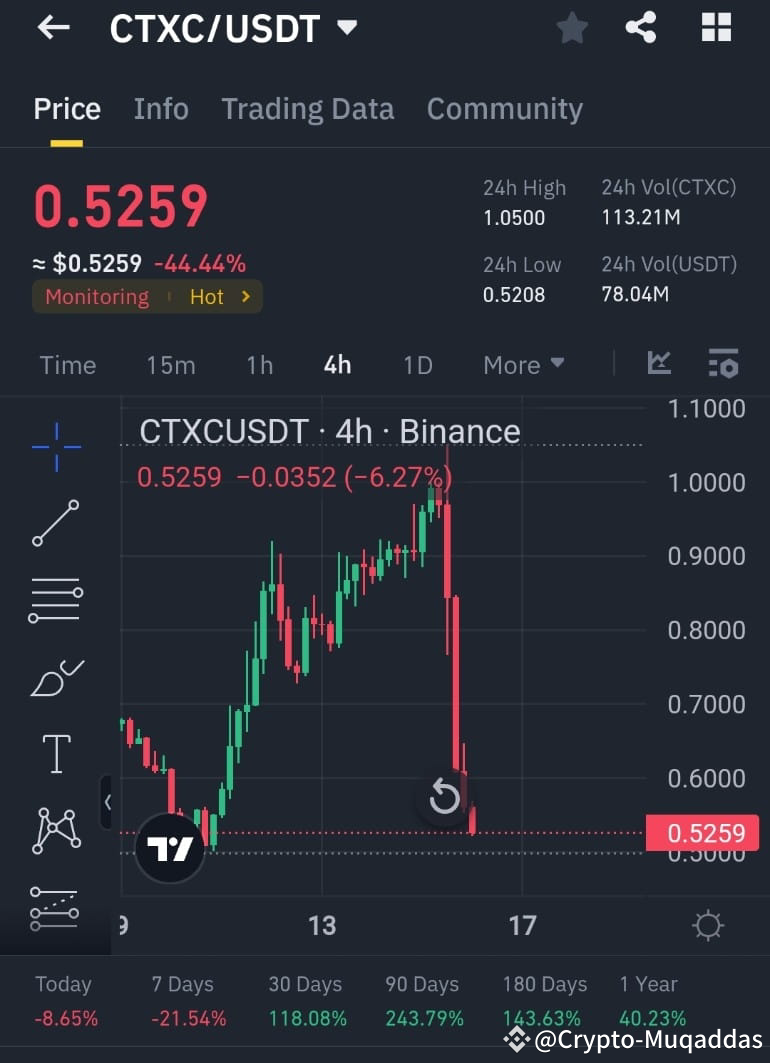
Current Price: $0.5259 (-44.44%)
Timeframe: 4H Chart
Analysis:
The chart shows an aggressive sell-off after a peak near $1.05, with price dropping significantly to $0.5259. The steep decline indicates strong bearish momentum; however, the price is nearing the recent 24H low of $0.5208, suggesting a potential support zone.
---
Long Position:
Entry Zone: $0.52 - $0.54
Stop Loss: $0.48 (below the support level)
Target 1: $0.63 (first resistance level)
Target 2: $0.75 (retracement towards key levels)
Rationale: If the price consolidates above $0.52, a reversal could occur as sellers exhaust. Oversold conditions can trigger buying.
---
Short Position:
Entry Zone: $0.56 - $0.58 (if price fails to hold above $0.54)
Stop Loss: $0.62 (above recent rejections)
Target 1: $0.50 (psychological round level)
Target 2: $0.45 (further decline)
Rationale: If price fails to sustain a recovery, further selling pressure may push it below current levels.
---
Conclusion: Traders should wait for price action confirmation. Bulls should look for stabilization at $0.52, while bears can target failed recovery attempts near $0.56. Manage risk carefully with stop losses in place.
#MicroStrategyJoinsNasdaq100 #BitcoinKeyZone #RLUSDApprovalBoostXRP #SuiHitsNewATH #Ctxcusdt
Current Price: $0.5259 (-44.44%)
Timeframe: 4H Chart
Analysis:
The chart shows an aggressive sell-off after a peak near $1.05, with price dropping significantly to $0.5259. The steep decline indicates strong bearish momentum; however, the price is nearing the recent 24H low of $0.5208, suggesting a potential support zone.
---
Long Position:
Entry Zone: $0.52 - $0.54
Stop Loss: $0.48 (below the support level)
Target 1: $0.63 (first resistance level)
Target 2: $0.75 (retracement towards key levels)
Rationale: If the price consolidates above $0.52, a reversal could occur as sellers exhaust. Oversold conditions can trigger buying.
---
Short Position:
Entry Zone: $0.56 - $0.58 (if price fails to hold above $0.54)
Stop Loss: $0.62 (above recent rejections)
Target 1: $0.50 (psychological round level)
Target 2: $0.45 (further decline)
Rationale: If price fails to sustain a recovery, further selling pressure may push it below current levels.
---
Conclusion: Traders should wait for price action confirmation. Bulls should look for stabilization at $0.52, while bears can target failed recovery attempts near $0.56. Manage risk carefully with stop losses in place.
#MicroStrategyJoinsNasdaq100 #BitcoinKeyZone #RLUSDApprovalBoostXRP #SuiHitsNewATH #Ctxcusdt