
#Bitcoin is struggling to surpass the resistance level of $27,800, while fears of a potential decline linger. If it fails to maintain a value above the $27,200 support, a further decrease is on the horizon.
Don't forget to follow us for more information from the world of cryptocurrencies 🔔
Overcoming the $27,800 resistance appears challenging.
- The price is oscillating below the $27,700 mark and below the 100-hour Simple Moving Average (SMA).
- On the hourly chart of BTC/USD, a break through a crucial ascending channel with support around $27,650 is evident.
- If the price drops below $27,200, we can expect additional negative movements.
- Bitcoin Faces Difficulty in Retaining Value
Following a downward correction, Bitcoin is attempting to recover and surpass $27,200 as its support. The price successfully managed to move above the $27,500 resistance.
Bitcoin ascended above the 50% Fibonacci retracement level, tracking the movement from $28,565 down to a minimum of $27,189. Nevertheless, bears remained active, keeping the price below $28,000, although it briefly traded above $27,850.
Moreover, the bearish market brought an additional retreat from the 61.8% Fibonacci retracement level and a fall below $27,500, coupled with a breach of a significant ascending channel with support near $27,650 on the BTC/USD hourly chart. The $27,200 support is now crucial, while the price remains below $27,700 and the 100-hour SMA.
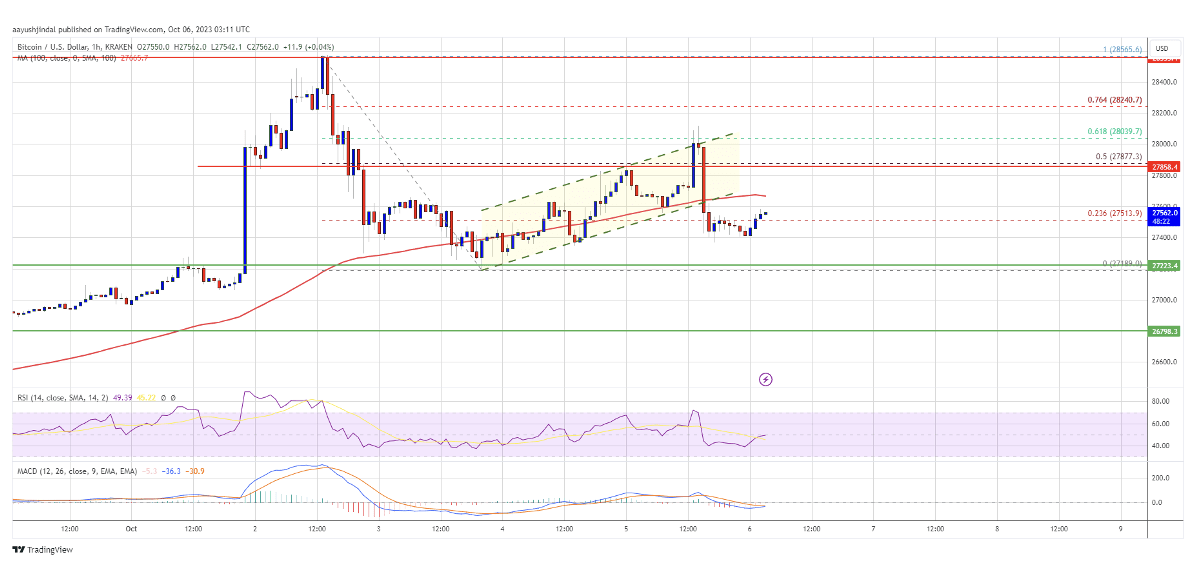
In particular, further resistance is seen around $27,650 and subsequently $28,000. If the price closes above $28,000, we might witness an increase towards $28,500, with additional gains potentially heading to $29,200.
Is There More Decline Ahead for Bitcoin?
If #BTC cannot proceed upwards and overcome the resistance at $27,800, further loss might follow. Immediate downward support lies near the $27,400 level.
The next substantial support is around the $27,200 mark. Any breakthrough and closure below this level could lead to a further drop towards $26,800, with the next support found at $26,200.
Technical indicators:
- Hourly MACD – The MACD is beginning to lose momentum in its bearish movement.
- Hourly RSI – The RSI for BTC/USD is approaching level 50.
- Main support levels – $27,400, followed by $27,200.
- Key resistance levels – $27,800, $28,000, and $28,500.
Notice:
,,The information and views presented in this article are intended solely for educational purposes and should not be taken as investment advice in any situation. The content of these pages should not be regarded as financial, investment, or any other form of advice. We caution that investing in cryptocurrencies can be risky and may lead to financial losses.“